Crude at $110: What It Means for India's Economy, Rupee and Stocks
Brent at $110: how it hits India's inflation, rupee and current account, which industries are hurt most, and what the 2008, 2011 and 2022 oil spikes showed.
A barrel of Brent crude costs about $110 today. A year ago it cost about $62. In rupees, the jump is bigger still: about ₹10,460 a barrel against about ₹5,390, a rise of 94%. India imports 88.7% of the crude it burns, so this is not a distant commodity story. It reaches petrol pumps, airfares, paint prices, tyre prices, bus tickets, the rupee and the government's budget.
This guide follows the price from the oil well to the Indian economy, industry by industry. It explains why crude is where it is, how India is exposed, what it has done to inflation, the current account and the rupee, which companies and sectors have suffered or held up, and what happened in the last big oil spikes of 2008, 2011 and 2022. Every claim carries a number.
Written on 21 October 2026. Brent figures are front-month futures unless stated. Some company and policy numbers come from press reports and brokerages, and the fact-check sheet shows confidence for each. Educational content, not investment advice or a price forecast.
- Brent is about $110.7 (21 Oct), up about 81% from a year ago and about 53% from $72.5 on 27 Feb, the day before the Iran war began. In rupees, the rise over a year is about 94%.
- It has been a violent year: a low of $60 on 7 Jan, a peak of $118 on 31 Mar, a fall to $73 on 30 Jun, and back above $110 now. Brent closed at or above $100 on 71 of 202 trading days in 2026.
- India imports 88.7% of its crude (FY26, a record). Its crude import bill for April to September was $90.6 billion, up 46% from $61.9 billion a year earlier.
- ICRA's scenarios put each $10 on crude at about +0.35 percentage points on the current account deficit, about -0.35 points on GDP growth and about +0.15 points on inflation. Other estimates range from +0.3% to +0.4% of GDP on the deficit.
- Inflation is rising: CPI was 5.54% in September and wholesale inflation 11.39%, with wholesale fuel and power up 25.85%. The RBI raised the repo rate by 25 basis points to 5.50% on 7 October.
- Delhi petrol is ₹102.12 and diesel ₹95.20, about 7.8% and 8.6% above a year ago. Prices have not changed since 25 May, so oil marketing companies are absorbing part of the cost.
- The hardest hit: airlines (fuel is 35% to 40% of costs), oil marketers (IOC fell about 31% since the war began), tyres, paints, logistics and city gas. Upstream producers and complex refiners posted record profits.
- After the 2008, 2011 and 2022 peaks, Brent was 68%, 16% and 30% lower six months later, and the rupee was weaker each time. This time, Brent has already bounced back to 94% of its March peak.
Where crude stands, and how we got here
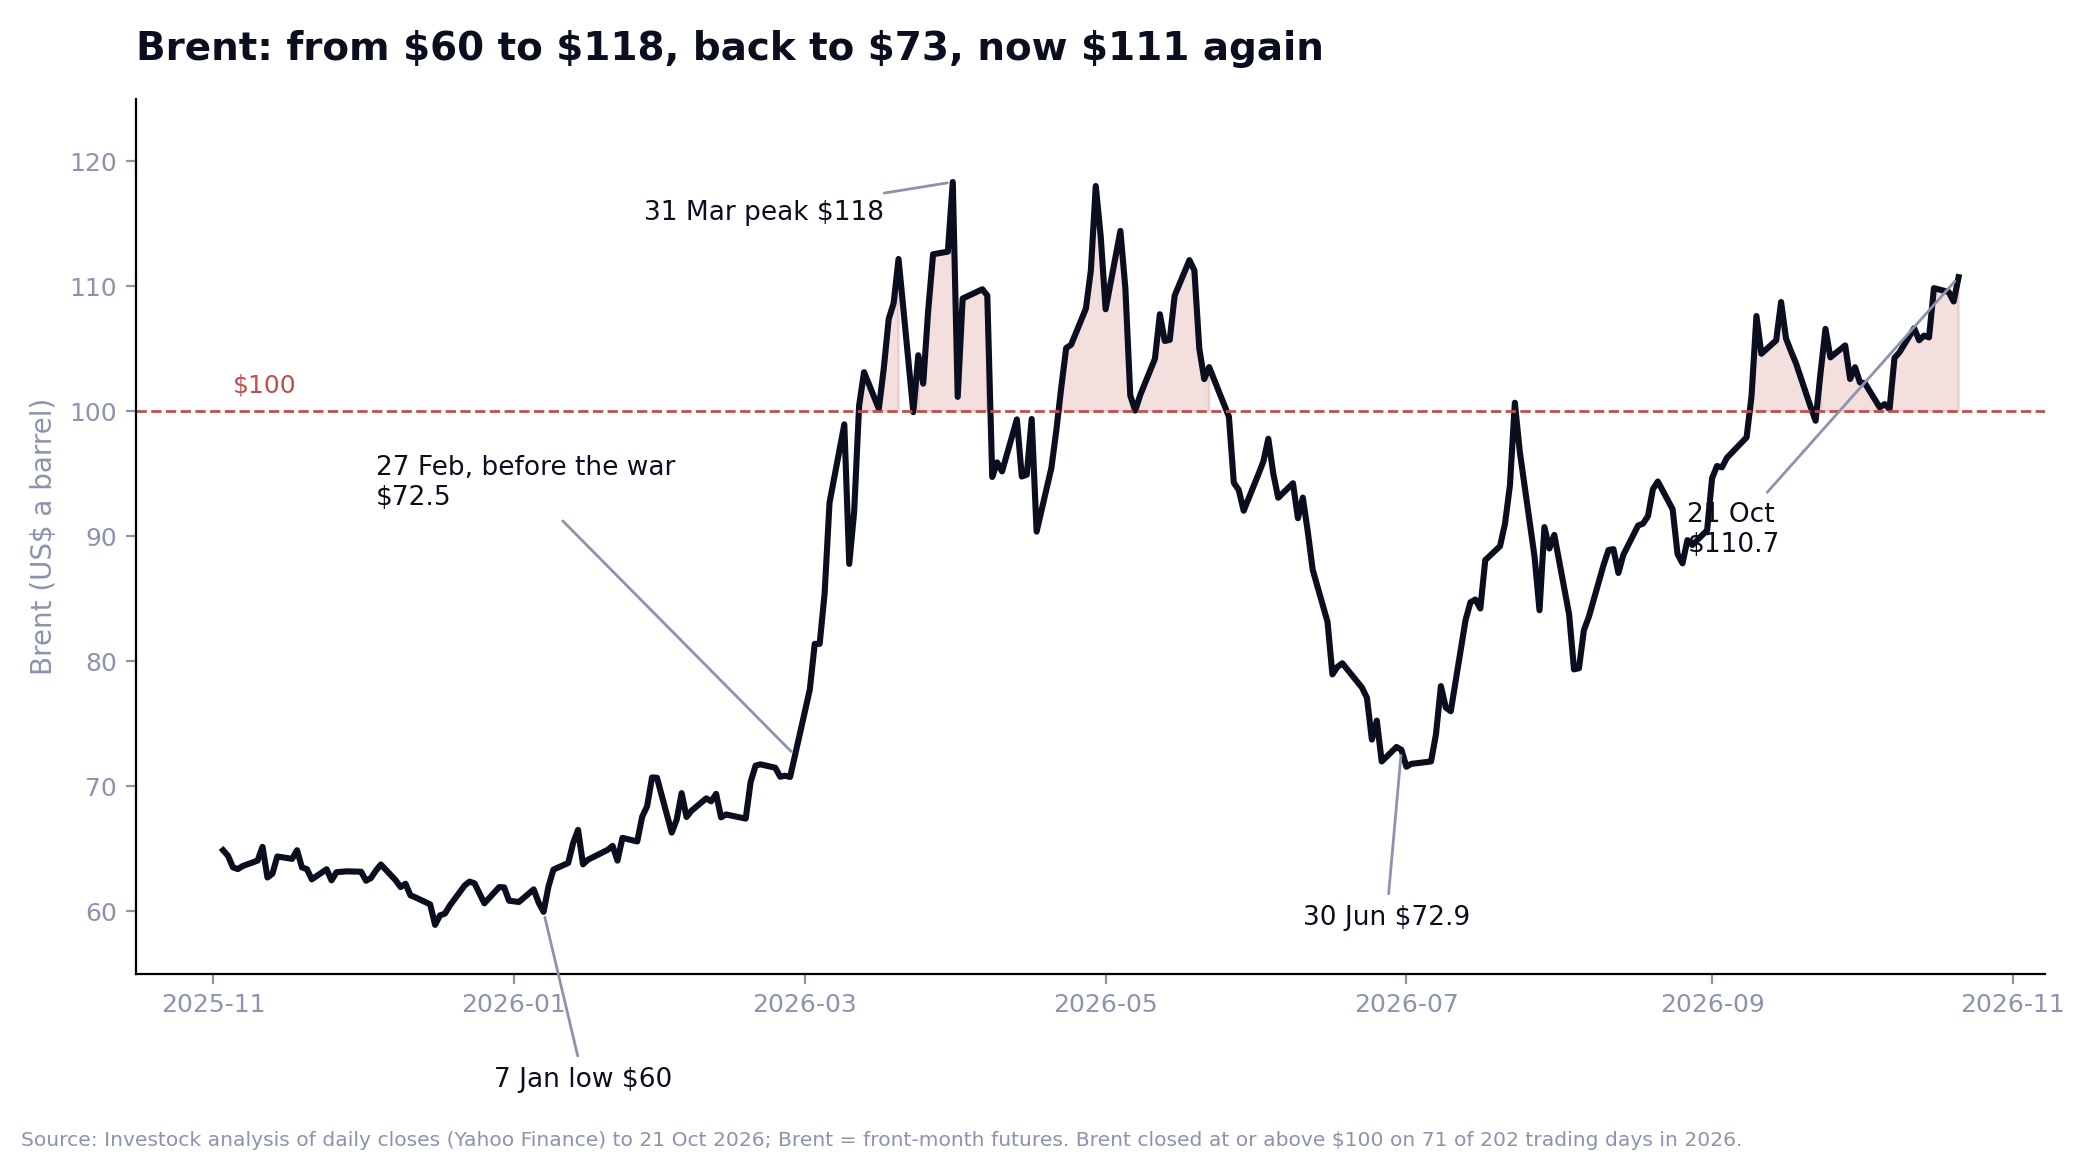
Brent began 2026 near $61. On 28 February, US and Israeli strikes on Iran began a war that cut tanker traffic through the Strait of Hormuz by about 70% within hours, according to press accounts. Up to a fifth of the world's seaborne oil passes through that strait. Brent crossed $100 in the first half of March (sources differ between 8 and 12 March) and the front-month contract closed at $118.35 on 31 March. The US Energy Information Administration (EIA) calls that quarter's rise the largest, adjusted for inflation, since 1988.
It did not stay there. A ceasefire on 8 April and an interim deal in June took Brent down to about $73 by 30 June. Then the truce collapsed on 8 July, tanker attacks continued (103 Iranian attacks were logged through 13 October), and Saudi Arabia's East-West pipeline was attacked in September. The EIA estimates that oil production shut in by the conflict peaked at 10.9 million barrels a day in May and was still 4.8 million in September. Global inventories fell by about 1.9 million barrels a day in the third quarter. Brent's September average was $114 on the EIA's spot measure, and the daily spot price reached $131 on 15 September.
The result is a price that has spent 71 of 202 trading days this year at or above $100, and 11 days at or above $110. (Different series give different peaks: the front-month futures close was $118.35, the EIA's spot price hit $131, and an intraday high of about $138 has been reported for early April. We use front-month closes in our charts.)
The rupee double: crude is dearer in rupees than in dollars
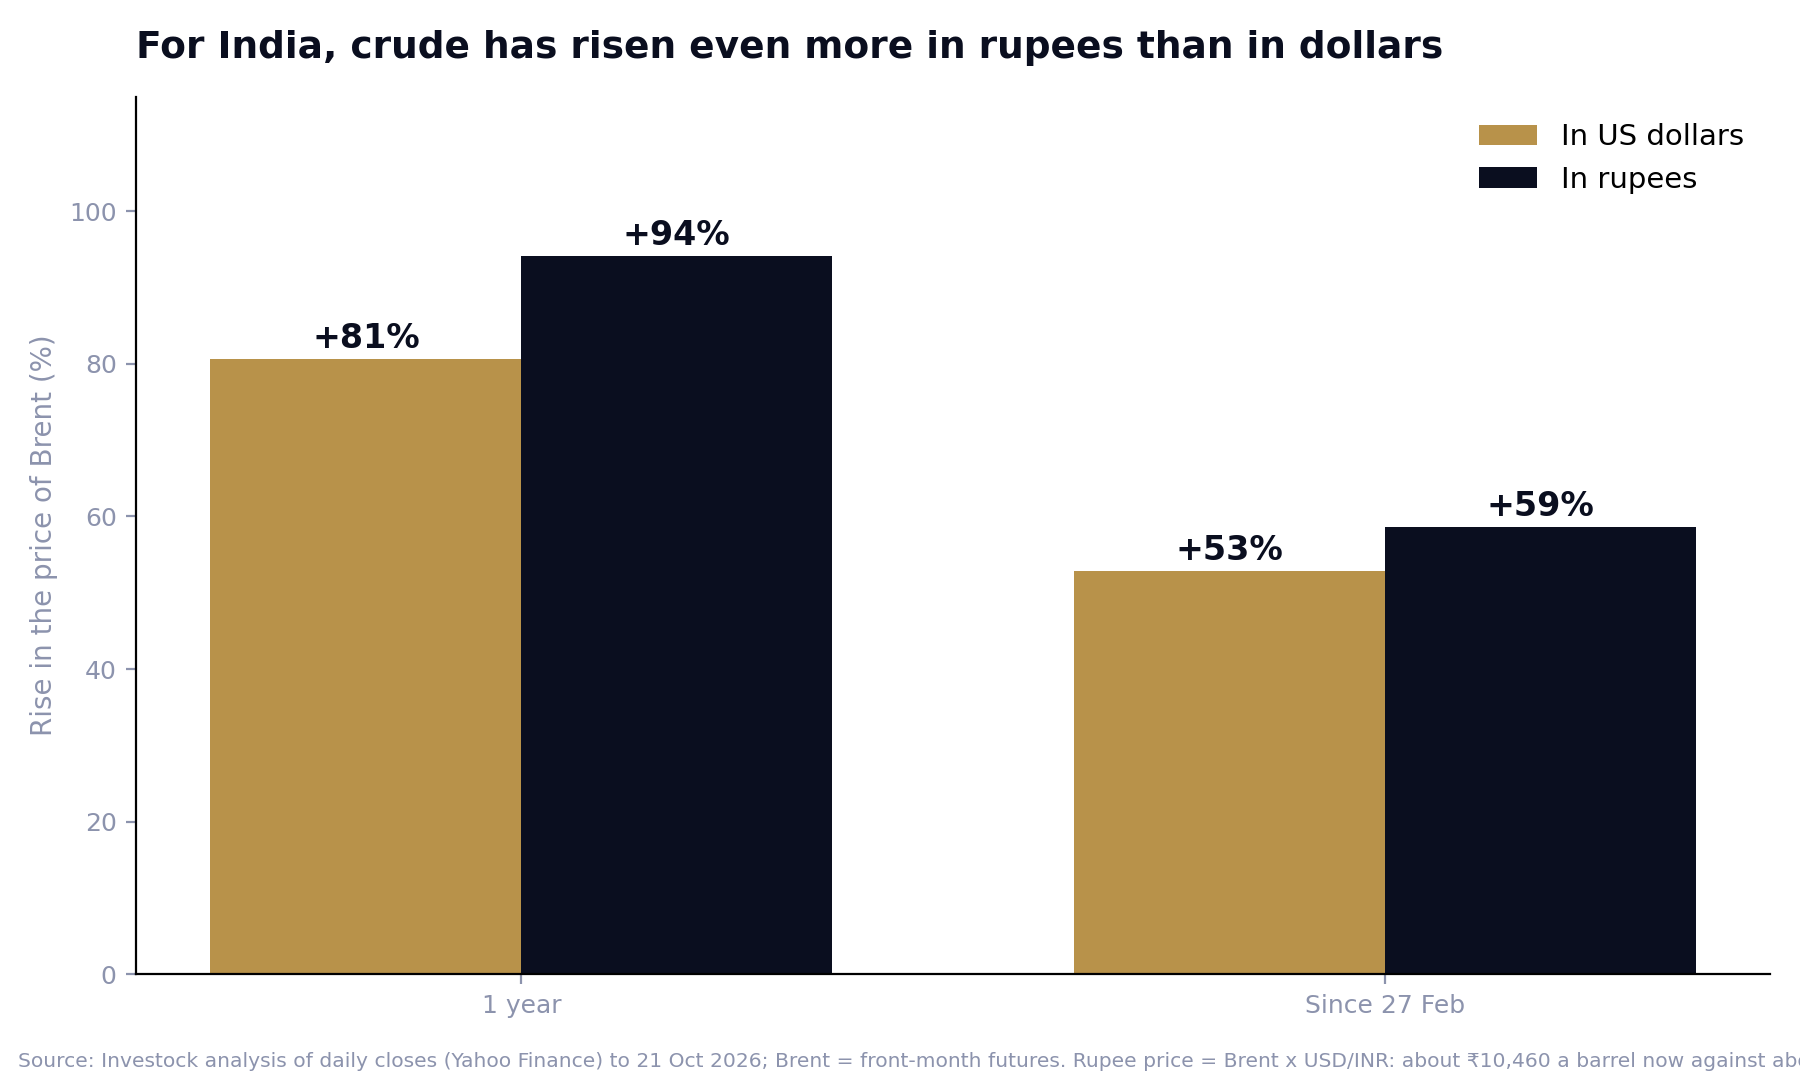
India pays for oil in dollars, so a weaker rupee makes every barrel costlier. The rupee was 91.0 per dollar on 27 February, hit a record close of about 96.9 and trades at about 94.5. The combined effect: a barrel that cost about ₹5,390 a year ago costs about ₹10,460 now, a rise of 94% against 81% in dollar terms. Since 27 February, the dollar price is up 53% and the rupee price 59%.
Why India is so exposed
| Indicator | Number | Period |
|---|---|---|
| Crude imported as a share of consumption | 88.7% (a record, provisional) | FY26 |
| Same, latest | 88.1% | Apr to Sep FY27 |
| Domestic crude output | 28.0 million tonnes | FY26 |
| Crude imports | 122.7 million tonnes, $90.6 billion (+46.3% from $61.9 billion) | Apr to Sep FY27 |
| Crude imports in one month | $15.4 billion, 21.7 million tonnes | Sept 2026 |
| Crude imports, earlier years | $132.4 billion (FY24), $137.0 billion (FY25) | Full years |
| Share of crude imports passing through Hormuz | About 40% before the war (estimates range from 30% to 52%) | Pre-war |
| Share of LPG and LNG imports passing through Hormuz | About 90% of LPG imports; over 50% of LNG | 2026 |
| Top suppliers by value | Russia 30.4%, Iraq 17.8%, Saudi Arabia 14.2%, UAE 11.4%, US 7.7% | Apr to Jan FY26 |
| Russia's volume | 2.65 million barrels a day in July, 1.74 in September (about 33% of imports) | 2026 |
| Strategic reserve | 5.33 million tonnes (about 39 million barrels) of capacity, about two-thirds full in March; the caverns cover about 8 to 10 days of imports | 2026 |
| Refining capacity | About 258 million tonnes a year | 2026 |
Sources: Rajya Sabha reply and PPAC data via ThePrint; Reuters, India Briefing, Kpler data via press; Petroleum Economist; Commerce Ministry data. Several figures are provisional or from secondary sources; see the fact-check sheet.
India refines crude into products it uses and exports, which cushions the economy. But it buys the raw material at world prices, and about two in five barrels normally come through a single strait. That is why a war in the Gulf moves India's inflation, deficit and currency in ways it does not move the US's.
How crude hits the economy: five channels
1. Inflation
India's consumer inflation was 5.54% in September (4.83% in August), with food at 7.74%. Wholesale inflation was 11.39% (from 9.92%), wholesale fuel and power was up 25.85%, and mineral oils were up 40.02%. The RBI now projects CPI of 5.2% for FY27, with 6.0% in the October to December quarter.
The direct effect is partly hidden because petrol and diesel prices have not been fully passed on. The indirect effects arrive through freight, packaging, airfares and city gas. Estimates of how much each $10 on crude adds to inflation vary widely: about +0.15 percentage points in ICRA's scenario grid, about +0.35 to 0.40 in one SBI Research write-up, and about +0.45 in an RBI-based rule of thumb reported in June. The old RBI rule was that a 10% rise above baseline adds about 0.3 points. The spread reflects how much of the rise is passed on.
2. The current account deficit
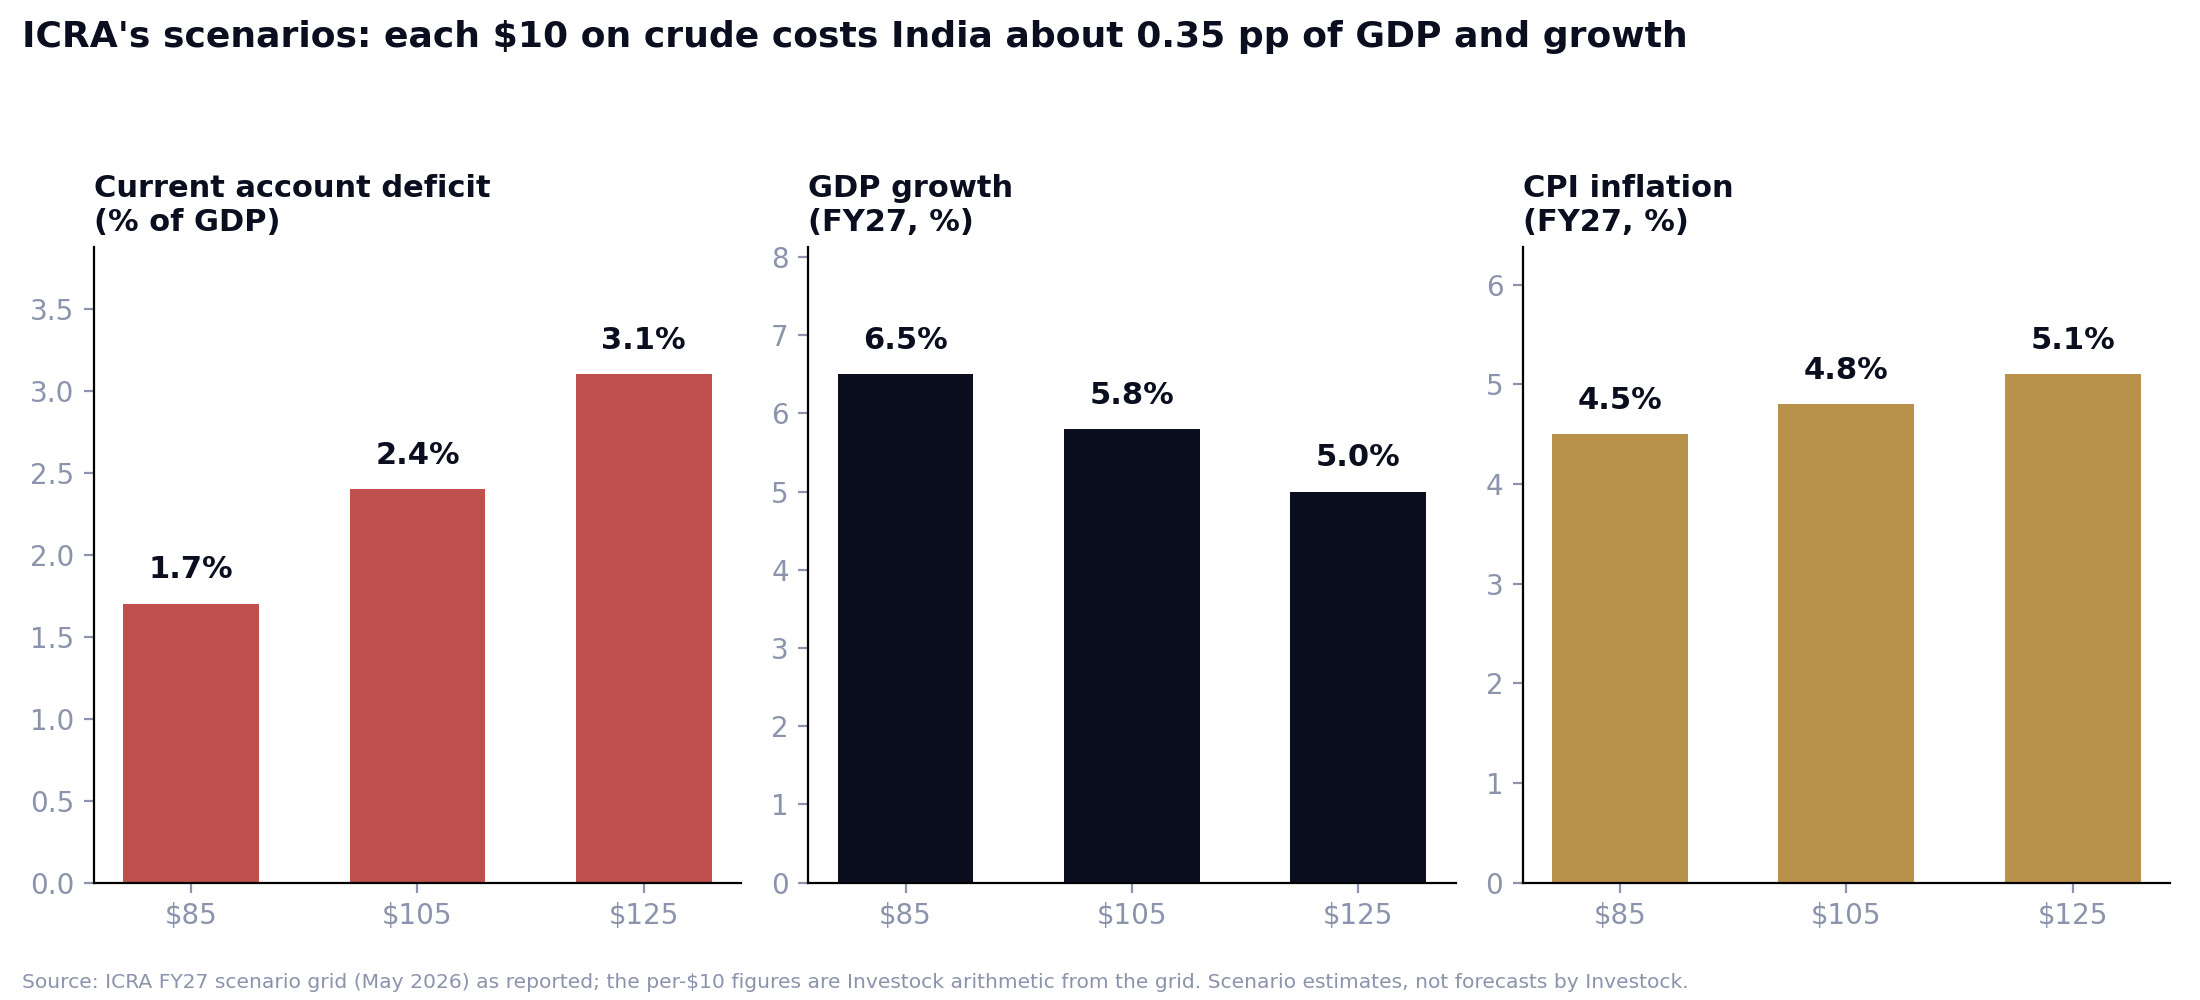
India's current account deficit was only 0.5% of GDP ($4.2 billion) in April to June, a comfortable start. But the oil bill is climbing: $15.4 billion in September alone. ICRA's May scenarios show the deficit at 1.7% of GDP for FY27 with crude at $85, 2.4% at $105 and 3.1% at $125. Other estimates for the full year range from 1.4% to 2.0% of GDP. S&P Global puts each $10 at about +0.4% of GDP.
3. The rupee and the reserves
A bigger oil bill means more dollar demand. The rupee reached a record close of about 96.9 per dollar this year and the RBI has been defending it. India's foreign exchange reserves fell from a record $785.7 billion on 4 September to $734.6 billion on 2 October, about $51 billion in four weeks, partly through intervention. In October the RBI opened a special dollar window for IOC, BPCL and HPCL, so that the oil marketers do not buy dollars in the open market. In June, it opened a swap window that drew $52.3 billion of foreign-currency deposits by 14 August.
4. The budget
The government cut special excise duty on petrol from ₹13 to ₹3 a litre and on diesel from ₹10 to nil on 26 March, at an estimated cost of about ₹7,000 crore per fortnight (about ₹5,500 crore net of export levies). Excise receipts fell 23% in April to July against a budget that assumed a 15.6% rise. The fertiliser subsidy had used 58% of its ₹1.71 lakh crore budget by 19 August, and estimates of the final bill range from ₹2.41 lakh crore upwards. The fiscal deficit target is 4.3% of GDP. Third-party scenarios show it slipping to between 4.5% and 5.0% in a prolonged war, though those scenarios assume crude well above today's.
5. Growth and interest rates
The RBI raised the repo rate by 25 basis points to 5.50% on 7 October, its first hike since February 2023, and shifted to a 'calibrated tightening' stance. It forecasts GDP growth of 7.1% for FY27. ICRA's scenario grid shows growth of 6.5% at $85 crude, 5.8% at $105 and 5.0% at $125. SBI Research's base case of 6.6% growth at $100 crude falls to 6.4% at $110, as reported.
What the government and RBI have done in 2026
| Date | Action | Detail |
|---|---|---|
| 26 to 27 Mar | Excise duty cut | Special excise on petrol ₹13 to ₹3; diesel ₹10 to nil; export levies introduced on diesel and ATF |
| 15 to 25 May | Pump price hikes | Delhi petrol ₹94.77 to ₹102.12 (+₹7.35); diesel ₹87.67 to ₹95.20 (+₹7.53) |
| 13 May | Gold and silver import duty | Effective duty raised to about 15% from about 6% (to curb dollar outflow) |
| 7 Jun | LPG price | 14.2 kg cylinder in Delhi ₹942; subsidised Ujjwala refills cut to 4 a year |
| Jun to 31 Aug | FCNR(B) swap window | RBI window drew $52.3 billion of foreign-currency deposits by 14 August |
| 7 Oct | Repo rate hike | 25 basis points to 5.50%; stance changed to 'calibrated tightening' |
| 12 Oct | Dollar window for oil companies | Special arrangement for IOC, BPCL and HPCL |
| 16 Oct | Export levies revised | Special additional excise on exports: petrol ₹2.5, diesel ₹8.5, ATF ₹10.5 a litre |
Sources: Reuters, Business Today, Moneylife, RBI statements, press reports. The current status of the March excise cut and of any windfall tax on domestic crude was not verified.
What households are paying
| Fuel (Delhi) | Now | A year ago | Change | Last revised |
|---|---|---|---|---|
| Petrol per litre | ₹102.12 | ₹94.77 | +7.8% | 25 May |
| Diesel per litre | ₹95.20 | ₹87.67 | +8.6% | 25 May |
| LPG 14.2 kg cylinder | ₹942 | about ₹853 | about +10% | 7 Jun |
| CNG per kg (IGL) | ₹86.98 | ₹77.09 (Jan 2026) | +12.8% since Jan | 29 Aug |
| ATF (aviation fuel) per litre, domestic | about ₹137 | ₹121.28 (1 Sep) | +14% in October alone (reported) | 1 Oct |
Sources: Business Today, IGL, press reports. The LPG year-ago figure and the ATF level are from secondary sources. Mumbai petrol is ₹111.21 and diesel ₹97.83.
Retail petrol and diesel have not changed since 25 May even though Brent is far above its May level. That means oil marketing companies are absorbing part of the gap. Estimates of the loss per litre differ enormously: Jefferies estimated about ₹26 on petrol and ₹30 on diesel in mid-October, on an Indian crude basket of about $125 a barrel; Emkay estimated a Q2 average of about +₹2.9 on petrol and -₹16.7 on diesel. These are not comparable: they use different crude prices and dates.
Other prices have moved. Maharashtra's state buses raised fares 13.56% from 18 July. IndiGo raised its fuel charge from 6 October to ₹375 to ₹1,300 per domestic sector (from ₹275 to ₹950). A transport-industry fuel adjustment formula adds about 0.65% to freight for every ₹1 a litre on diesel.
Industry by industry: who is hurt, who is helped
| Industry | Crude link | What the numbers show |
|---|---|---|
| Airlines | Fuel is 35% to 40% of operating cost (IndiGo about 42% in Q1) | IndiGo's fuel bill rose 86% to ₹10,833 crore; net loss ₹238 crore against a ₹2,176 crore profit; domestic traffic fell 6.34% in August; Crisil's stress test: airline profit about -50% at $110 average crude |
| Oil marketers (IOC, BPCL, HPCL) | Crude is the input; retail prices are held | Q1 FY27 losses: HPCL about ₹11,526 crore, BPCL about ₹3,962 crore, IOC about ₹2,661 crore (press reports differ on BPCL); Nomura: each $10 on crude can cut combined EBITDA by up to ₹77,000 crore |
| Upstream (ONGC, Oil India) | They sell crude | ONGC's realisation was $99.45 a barrel in Q1 (against $66.13) and its pre-tax profit a record ₹22,848 crore; Oil India's profit a record ₹2,870 crore |
| Refiners | Product margins widen | Singapore refining margin about $25 a barrel in April to August against $6.5 in FY26 (ICRA); Reliance's oil-to-chemicals EBITDA ₹17,010 crore (+17.2%); but export levies bite |
| Paints | About 30% of production cost (Crisil) | Asian Paints has raised prices about 10.5% to 11% in total; Berger's material costs rose 28.5% against revenue growth of about 12%; Indigo Paints' gross margin fell to 45.3% from 48.6% |
| Tyres | Raw materials about 70% of cost; synthetic inputs are crude-linked | CEAT's Q2 margin fell to about 9.6% from 13.3% and profit fell 39.8%; Crisil sees FY27 operating margins near 12%, down 200 to 250 basis points |
| Logistics and transport | Diesel is 40% to 60% of trucking cost | Delhivery's Q1 profit fell 65% (also affected by an acquisition); bus fares up in several states |
| City gas (CNG and PNG) | Imported LNG costs | IGL's Q1 margin fell to ₹3.4 a cubic metre from ₹6.2; Delhi CNG is up 12.8% since January |
| Cement | Power and fuel 26% to 28% of cost | Crisil sees margins down 150 to 200 basis points to 16% to 18%; petcoke averaged ₹15,850 a tonne in April to July (+39% YoY) |
| FMCG and chemicals | Packaging, palm oil and freight | HUL's gross margin 49.5% (-79 basis points); Pidilite's 53.3% (-70); Supreme Industries' volumes fell 14.3% |
| Fertilisers | Natural gas is the main input for urea | Subsidy bill running well above the ₹1.71 lakh crore budget |
| Autos | Demand side: fuel prices | Passenger vehicle dispatches rose 21.8% in September; electric car registrations were up 94% year on year |
Sources: company results and press coverage, Crisil, ICRA, Nomura, Emkay, SIAM and DGCA data as reported. Figures are for different periods (mostly Q1 FY27 and September 2026); Q2 FY27 results for most of these companies are not out yet.
Who has a cushion
- Upstream oil producers (ONGC, Oil India): record profits on higher realisations, though the status of any windfall levy is unclear.
- Complex refiners: BPCL's gross refining margin was reported at $41.4 a barrel in Q1, CPCL's at $8.78 against $3.22 a year earlier.
- Shipping: Great Eastern Shipping's Q1 profit was ₹1,309 crore against ₹505 crore a year ago.
- Coal-based power: LNG disruption pushed the government to order imported-coal plants to run at full capacity, while 16 GW of gas-grid plants received no Qatari cargoes in April and May.
- Electric vehicles: electric cars were 8.3% of September passenger vehicle registrations, and EV registrations rose to 333,571.
What the market has done
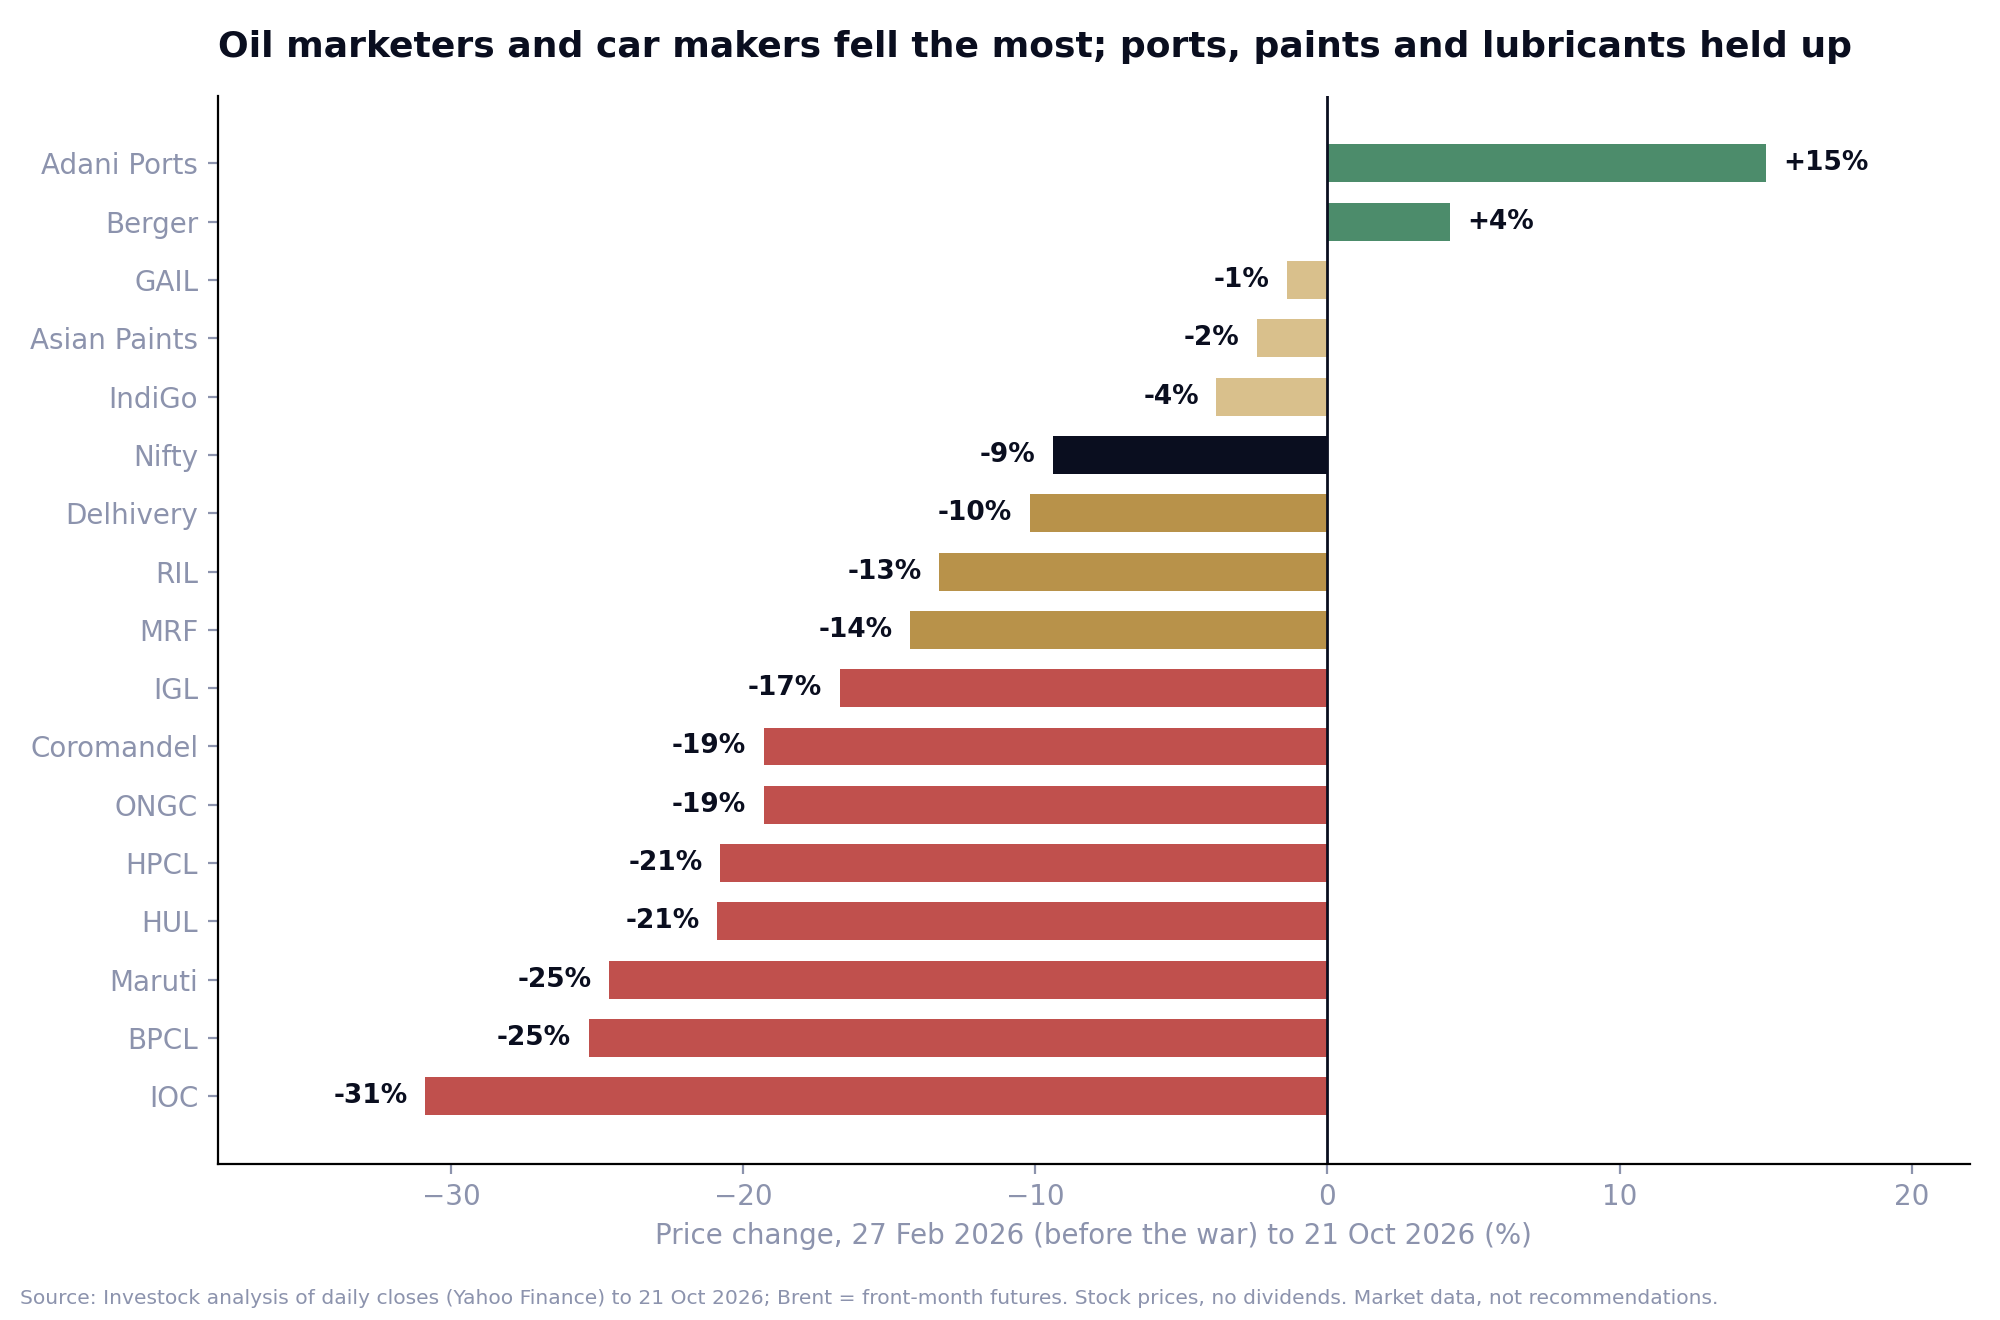
Since the war began, the Nifty 50 is down about 9.4%. The worst performers include the oil marketers (IOC -31%, BPCL -25%, HPCL -21%), Maruti (-25%), HUL (-21%) and Coromandel International (-19%). The ones that held up include Adani Ports (+15%), Castrol India (+5%), Berger Paints (+4%) and VRL Logistics (+3%). Even ONGC is down about 19%, despite the record profit, which shows that crude's effect on a share price is not a simple one.
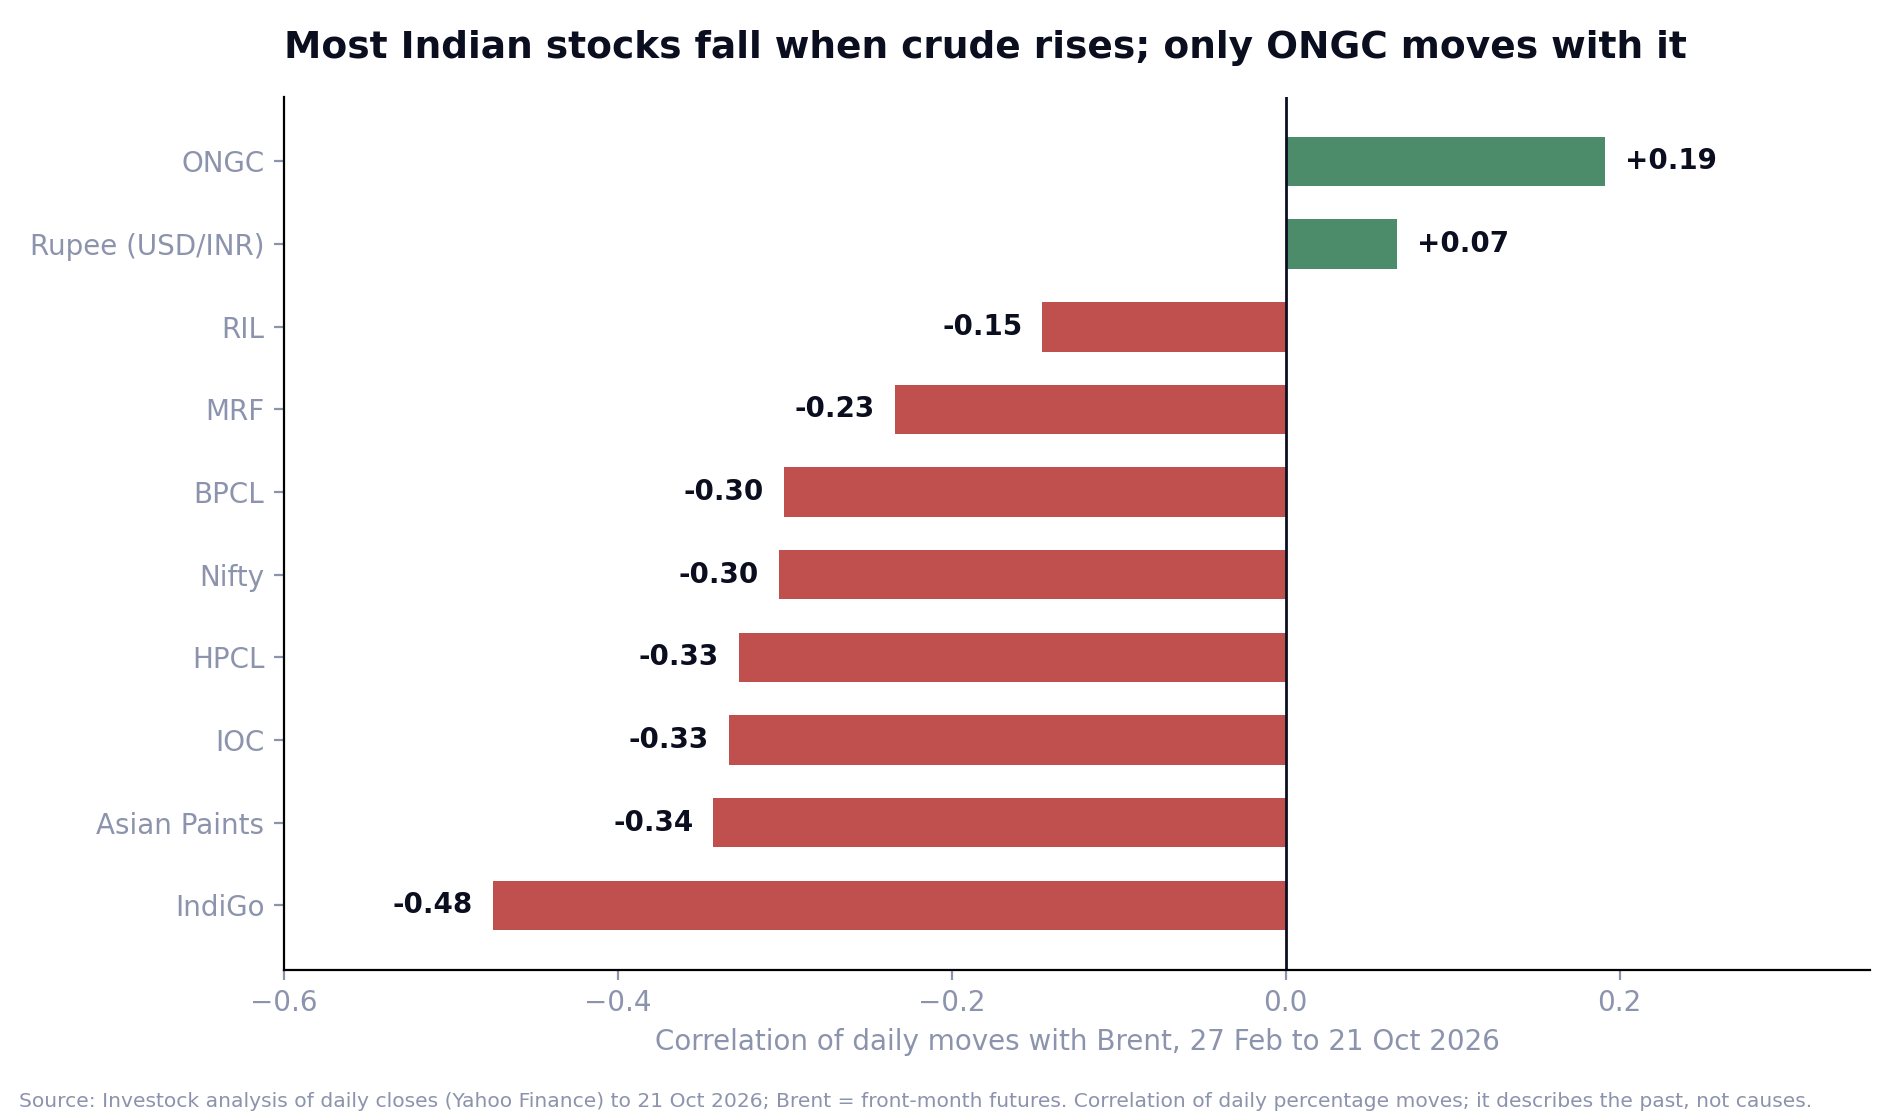
On a day-by-day basis, the Nifty's daily moves had a correlation of -0.30 with Brent's since 27 February. IndiGo (-0.48), the paint company Asian Paints (-0.34), HPCL (-0.33), IOC (-0.33) and BPCL (-0.30) moved most against crude. Only ONGC moved with it (+0.19). Correlation describes what happened, not why.
What happened the last times
| 2007 to 2008 | 2010 to 2014 | 2021 to 2022 | 2026 (now) | |
|---|---|---|---|---|
| Brent peak (front-month) | About $146 (3 Jul 2008); about $147 intraday | About $127 (8 Apr 2011); $100+ for most of 2011 to 2014 | About $128 (8 Mar 2022); about $139 intraday | $118.35 (31 Mar); now $110.7 |
| Days at or above $100 | Jan to Jul 2008 | 831 of 938 trading days (Mar 2011 to Dec 2014) | 106 days in 2022 | 71 of 202 so far |
| Current account deficit | 1.5% (FY08), 2.3% (FY09) | 4.2% (FY12), 4.8% (FY13, a record) | Q2 FY23: 4.4% | 0.5% (Q1 FY27); forecasts 1.4% to 2.0% |
| Inflation | Wholesale peaked near 12% to 13% | CPI 10.21% (FY13), 9.49% (FY14) | CPI 5.5% (FY22), 6.7% (FY23) | CPI 5.54% (Sept); RBI sees 6.0% in Q3 FY27 |
| Rupee | A fall of about 19% in 2008 by end-September (as reported) | Record 68.85 per dollar (Aug 2013); the 'fragile five' | About 83 by Oct 2022 | Record close about 96.9 |
| Policy response | Pump prices raised in June 2008; about ₹1.4 lakh crore of oil bonds issued 2005 to 2010 | Gold import curbs, rate rise, FCNR(B) swap window of over $30 billion (Sept 2013) | Excise cuts (Nov 2021 and May 2022); export levies (Jul 2022); repo rate 4.00% to 6.50% | Excise cut, pump price hikes, gold duty hike, swap window, repo +25 bp |
| Equities | Sensex fell from 21,207 (Jan 2008) to about 7,700 (Oct 2008) | Nifty -16% in the six months after the 2011 peak | Nifty +11% in the six months after the peak | Nifty -9.4% since the war began |
Sources: RBI, Economic Survey, Lok Sabha replies, Macrotrends, press reports as noted; Investock analysis of Yahoo Finance data (Brent front-month futures, Nifty, USD/INR). Some historical figures are from secondary sources. The 1990 to 91 Gulf-war balance-of-payments crisis, when India pledged 67 tonnes of gold and devalued the rupee about 18% in July 1991, is a different scale of event.
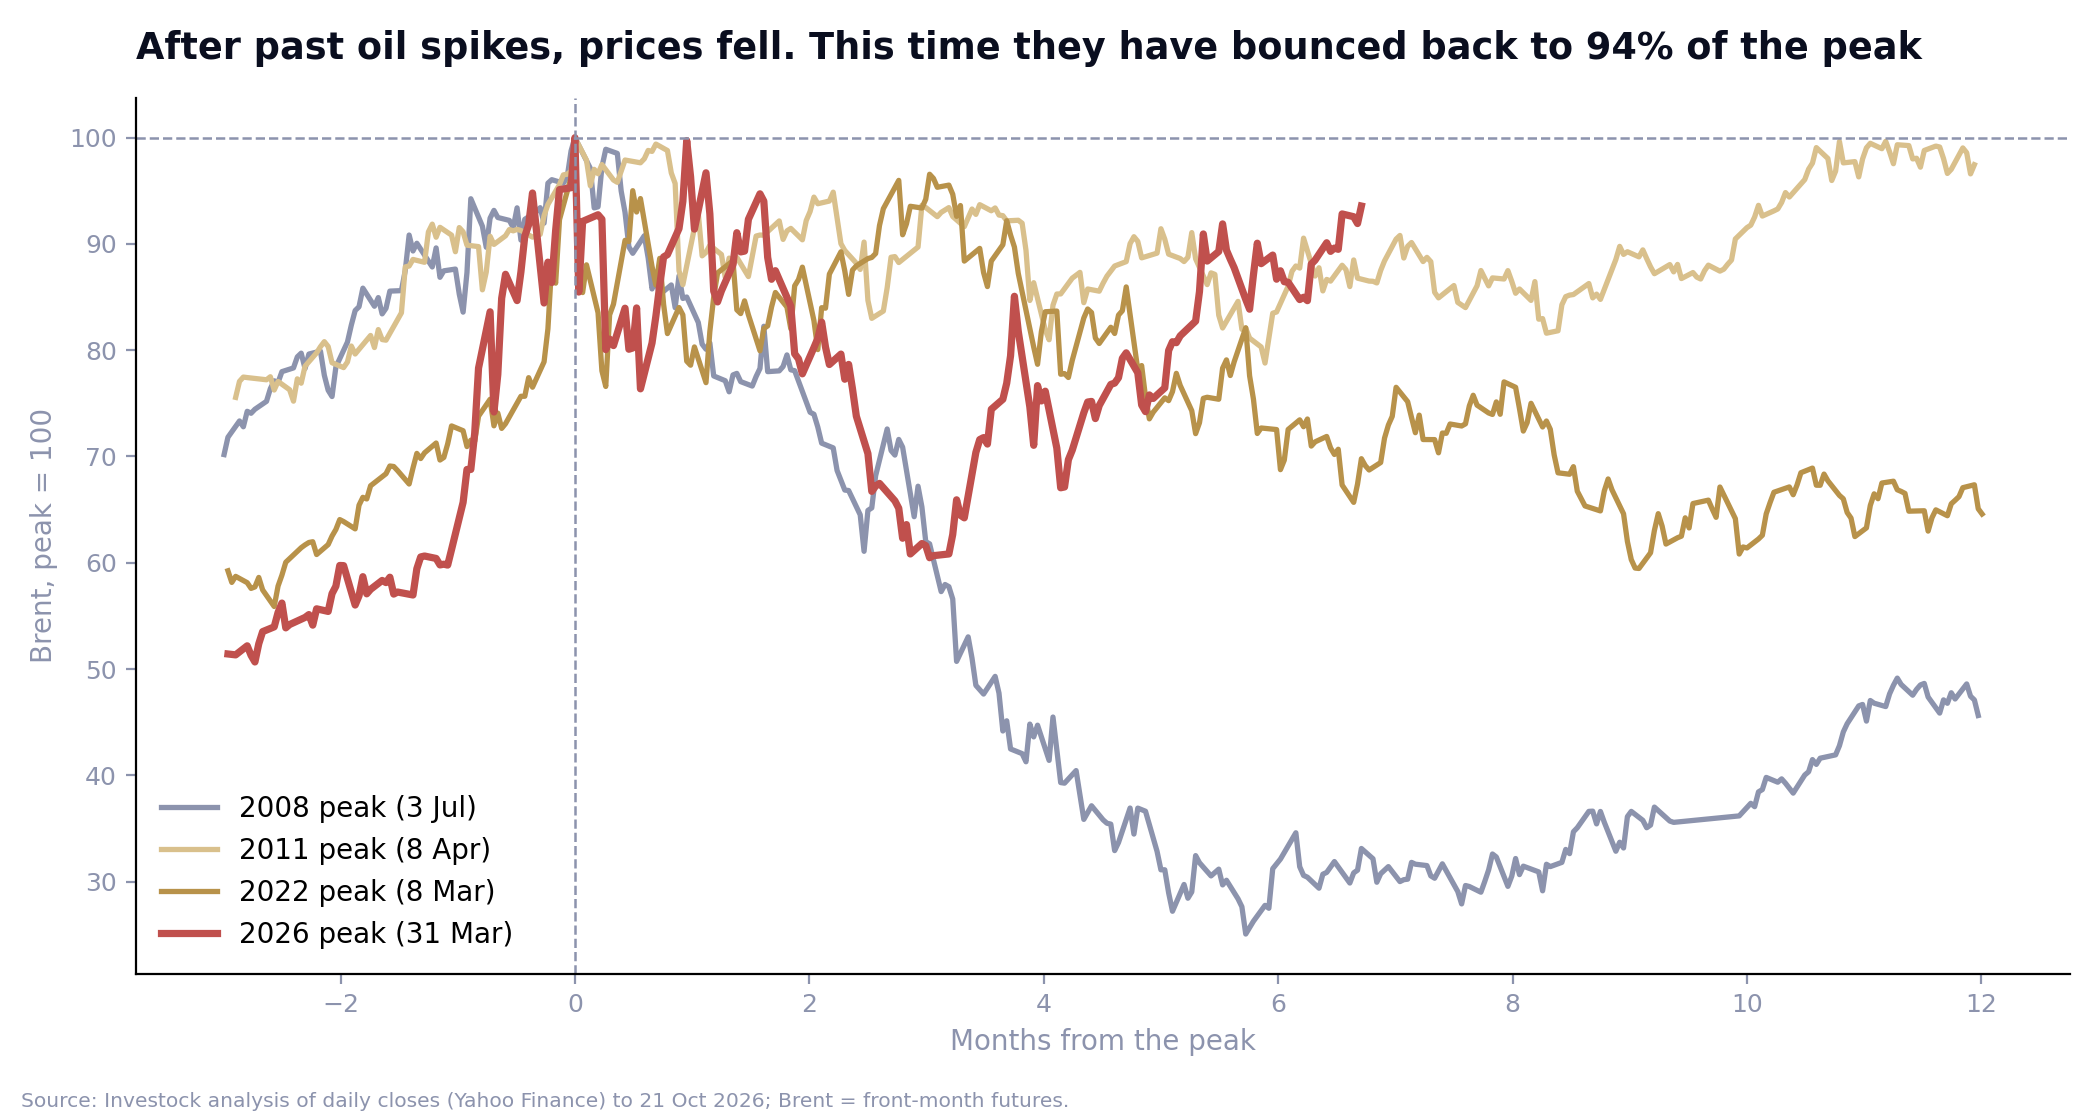
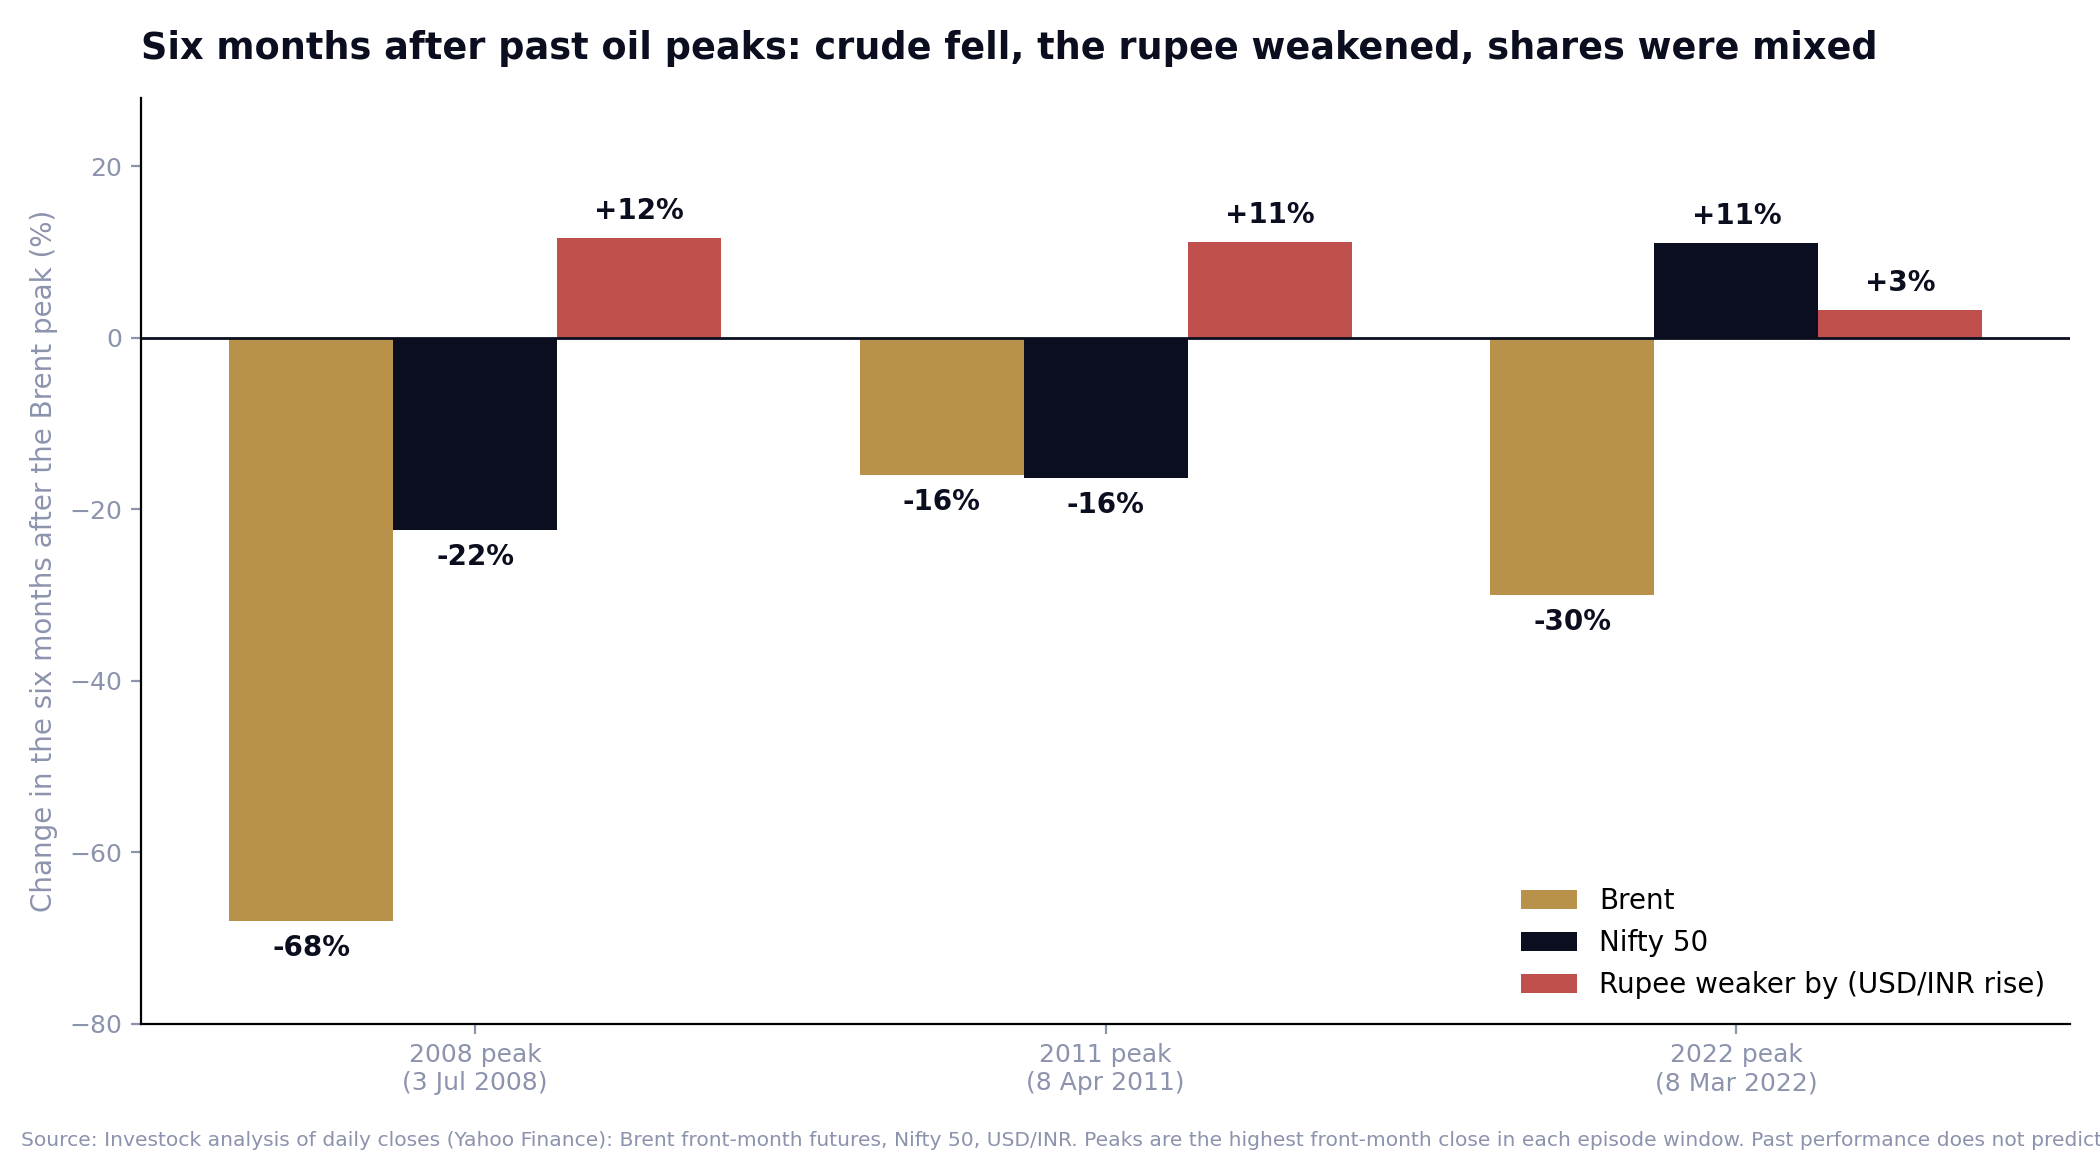
Three lessons stand out. First, spikes were followed by falls: six months after the peak, Brent was 68% lower in 2008, 16% lower in 2011 and 30% lower in 2022. But the speed varied hugely. It took 7 days after the 2022 peak for Brent to drop 20%, 36 days in 2008 and 179 days in 2011. Second, the rupee was weaker six months after every one of those peaks (by about 12%, 11% and 3%). Third, shares were mixed: the Nifty was 22% and 16% lower six months after the 2008 and 2011 peaks, but 11% higher after 2022.
Is this time different?
The shape of this episode is unusual. Brent hit its peak on 31 March, fell by about 38% to $72.9 by 30 June, and has now climbed back to $110.7, which is 94% of the peak. After the 2008, 2011 and 2022 peaks it never regained that much of the high within seven months. The war is also still active, with the EIA reporting 4.8 million barrels a day of production shut in during September.
India's cushions are better in some ways and thinner in others:
- Stronger: the current account deficit was only 0.5% of GDP in April to June (it was 4.8% in FY13), the RBI projects 7.1% growth, and reserves are still $734.6 billion.
- Weaker: reserves have fallen by about $51 billion in four weeks, the rupee has hit record lows, wholesale inflation is 11.39%, and the budget has less room because excise receipts are down.
Forecasts are a range. The EIA (6 October) expects Brent to average about $105 in Q4 2026, $87 in Q2 2027 and $84 across 2027. Goldman Sachs (11 October) forecast $90 by December 2026 and $80 in 2027, with scenarios from about $125 if Gulf output stays 5 million barrels a day below February levels to the $60s if it recovers. These are third-party forecasts and not ours.
What to watch next
| Date | Event | Why it matters |
|---|---|---|
| 21 Oct | RBI MPC minutes | How members weighed oil against inflation |
| Weekly | RBI forex reserves (Fridays) | $734.6 billion on 2 Oct and about $726 billion in the week to 9 Oct (reported as a fifth weekly fall); shows the cost of defending the rupee |
| 27 to 28 Oct | US Fed meeting | Dollar and yield moves affect the rupee and oil in rupee terms |
| 29 Oct | Asian Paints Q2 results | How paints are passing through raw-material cost inflation (one unverified broker estimate puts it near 25%) |
| Late Oct to Nov | Q2 results of IOC, BPCL, HPCL, ONGC, IndiGo and Reliance | First Q2 data on losses and margins |
| 1 Nov | OPEC+ meeting | Seven members held November quotas at 31.01 million barrels a day on 4 October |
| 12 Nov | India CPI for October | Whether the 6.0% projection for Q3 is on track |
| 2 to 4 Dec | RBI policy meeting | Next decision on rates |
Dates as reported; confirm before relying on them. The 12 November CPI date follows the usual release pattern and has not been confirmed.
How Investock thinks about an oil shock
We do not forecast crude. Commodity shocks are where rules matter more than opinions. Investock's Model Portfolio uses equal weights, so no single sector or stock can quietly dominate; entries happen on a fixed day (Monday); and each position has a predefined exit rule. That cannot prevent losses, and a model portfolio can lose money. It is a process meant to keep behaviour steady when headlines are not.
Related reading
- RBI policy day explained: what the repo rate means for you
- Position sizing for small accounts: how much to put in one stock
- Market down 8 weeks in a row: what history says and what you can do
Frequently asked questions
Why is crude oil at $110?
A war involving Iran that began on 28 February has disrupted shipping through the Strait of Hormuz, through which up to a fifth of the world's seaborne oil passes. The EIA estimates that production shut in peaked at 10.9 million barrels a day in May and was 4.8 million in September, and global inventories are falling.
How much of its oil does India import?
About 88.7% (FY26, a record). Crude imports in April to September were 122.7 million tonnes worth $90.6 billion, up 46% in value from a year earlier.
How does crude oil affect the Indian economy?
Through inflation, the current account deficit, the rupee, the government budget and growth. ICRA's scenarios put each $10 at roughly +0.35 percentage points on the deficit and -0.35 points on GDP growth, with a smaller effect (+0.15 points) on inflation. Other estimates differ.
Have petrol and diesel prices risen?
Delhi petrol is ₹102.12 and diesel ₹95.20, about 7.8% and 8.6% above a year ago. The last revision was on 25 May. Oil marketing companies are absorbing part of the gap, and estimates of their loss per litre vary widely; we cannot say whether prices will change.
Which sectors are hurt most by high crude?
Airlines (fuel is about 35% to 40% of costs), oil marketing companies, tyres, paints, logistics, city gas, cement and fertilisers. Upstream producers, complex refiners and shipping companies have benefited.
What happened to the rupee in past oil spikes?
Six months after the Brent peaks of 2008, 2011 and 2022, the rupee was weaker by about 12%, 11% and 3% against the dollar. Past episodes do not predict the future.
Is India's current account deficit a worry now?
It was just 0.5% of GDP in April to June. Forecasts for FY27 range from 1.4% to 2.0% of GDP, against a record 4.8% in FY13. The oil bill is rising, so it bears watching.
Sources
- Brent, rupee, Nifty, stock prices and all calculations (rupee cost of crude, days above $100, returns since 27 Feb, correlations, six-month changes after past peaks): Investock analysis of daily data (Yahoo Finance) to 21 Oct 2026. Brent = front-month futures.
- Price path, the war timeline, supply shut-ins, forecasts: EIA Short-Term Energy Outlook (6 Oct 2026) and Today in Energy; Wikipedia (2026 Strait of Hormuz crisis); Goldman Sachs and OPEC+ via press reports.
- India's oil dependence and import data: PPAC and Rajya Sabha reply via ThePrint; Tribune, Business Standard; Kpler via press; India Briefing; Petroleum Economist; Commerce Ministry data.
- Macro numbers: RBI Governor's statement and MPC resolution (7 Oct 2026); MoSPI CPI release (Sept 2026); WPI via Moneylife; RBI data on forex reserves and CAD via press.
- Sensitivities and scenarios: ICRA (FY27 scenario grid, May 2026); S&P Global; SBI Research via press; RBI Monetary Policy Report (April 2021) and an RBI staff study via Business Standard.
- Past episodes: RBI, Economic Survey, Lok Sabha replies, Macrotrends, press reports (see the fact-check sheet).
- Government and RBI actions: Reuters (via Gulf Times), Moneylife, Tribune, Business Today, HDFC Mutual Fund fiscal note, Ashoka University paper.
- Industries and companies: company results as reported by Kotak Neo, Outlook Business, PL Capital, ICRA, Crisil, Nomura, Emkay, Jefferies; SIAM and DGCA data; Angel One; Business Today.