Position Sizing for Small Accounts: How Much to Put in One Stock
How much of your account should go into one stock? Learn the 1% rule, equal weights, cost traps and F&O lot-size limits for Rs 50,000 to Rs 2 lakh accounts.
Two stocks sit in the same Rs 1 lakh account. One is a Rs 2,000 position that doubles. The other is a Rs 40,000 position that falls 30%.
The winner adds Rs 2,000 to your account, a 2% gain. The loser takes away Rs 12,000, a 12% loss. Your account is down 10%, even though one of your stocks doubled.
Which stock you pick matters. How much you put into it often matters more. That is position sizing, and it is the most ignored skill in retail investing, especially for small accounts, where one bad bet can undo months of effort and where costs, whole-share rounding and F&O lot sizes all push in the wrong direction.
We looked at the maths, ran a simulation on ten years of real prices for 44 large-cap NSE stocks, and checked India's costs and contract sizes. Here is what we found, and a simple way to decide how much to put in one stock.
- Position sizing means how much money goes into one idea. It decides how much any single mistake can cost you.
- A stock that makes up 40% of your account and falls 30% costs you 12% of the account. At 10% of the account, the same fall costs 3%.
- Ten losing trades in a row cost about 9.6% of your account if you risk 1% a trade, and about 65% if you risk 10% a trade.
- In our test of random baskets, a single stock ended a 12-month period in a loss 27% of the time, against 11% for a 10-stock basket. The typical outcome barely changed. The bad outcomes shrank.
- Small accounts face extra traps: flat fees make a Rs 2,000 position cost about 1% round trip, India has no fractional shares, and one Nifty lot is worth about Rs 14.7 lakh.
- A simple method: decide the loss you will accept per trade (many people use 1% to 2%), set your stop first, size the position from it, and cap any single position.
- We built a free calculator that does the arithmetic for you.
What position sizing is, and what it is not
Position sizing answers one question: how many rupees go into this idea? It is different from picking a stock, from diversification (how many different ideas you hold) and from asset allocation (how you split money between shares, bonds and cash).
It is also not a prediction. You do not need to know whether a stock will rise to size it well. You only need to decide how wrong you can afford to be. That is why it is the part of investing you fully control.
One position can sink a small account
The loss a single stock can inflict on your account is simply its weight multiplied by its fall:
| Position as % of account | Stock falls 20% | Stock falls 30% | Stock falls 50% |
|---|---|---|---|
| 5% | -1.0% | -1.5% | -2.5% |
| 10% | -2.0% | -3.0% | -5.0% |
| 20% | -4.0% | -6.0% | -10.0% |
| 40% | -8.0% | -12.0% | -20.0% |
Loss to the whole account, before any other positions move. Simple arithmetic.
Large falls are not rare, even in well-known names. In our data on 44 long-listed large-cap NSE stocks from January 2016 to October 2026, the typical stock suffered a peak-to-trough fall of about 51% at some point. 82% of them fell more than 40% at some stage, and the worst fell 85%. For comparison, the Nifty 50's deepest fall in the same period was about 38%, in March 2020.
Dividend-adjusted daily closing prices (Yahoo Finance). The stock list is fixed, so survivorship bias applies. Past performance is not indicative of future results.
The maths of survival
Losses are lopsided. The bigger the fall, the more disproportionate the gain needed to get back to where you started:
| Loss | Gain needed to recover |
|---|---|
| -10% | +11.1% |
| -20% | +25.0% |
| -30% | +42.9% |
| -40% | +66.7% |
| -50% | +100% |
| -60% | +150% |
Gain needed = loss ÷ (1 - loss). The same table appears in Zerodha Varsity and other risk-management sources.
That is why bet size matters so much when you hit a bad patch. Take ten losing trades in a row. It is not a forecast, but losing streaks happen. Here is what each trade's size does to your account:
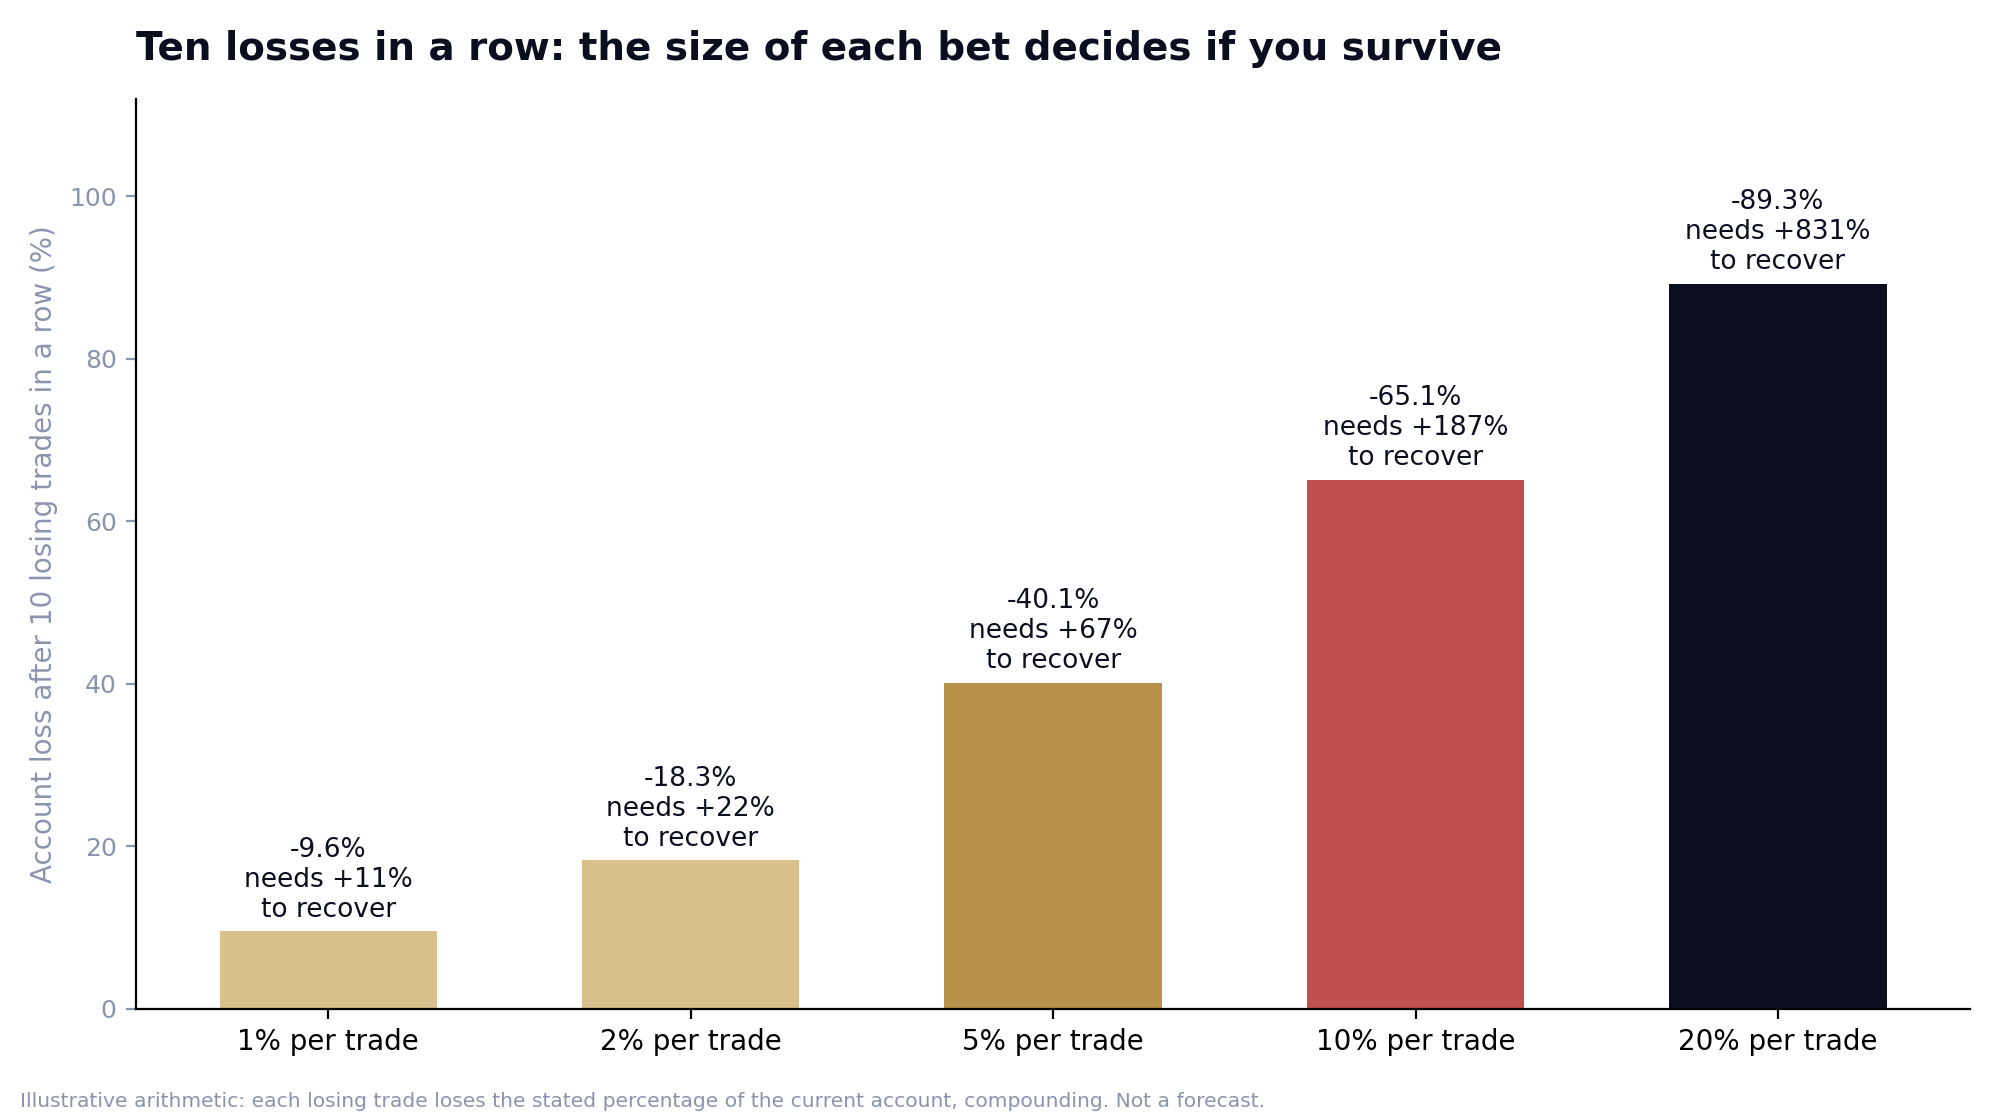
At 1% risk a trade, ten straight losses cost about 9.6%, which is painful but recoverable with a gain of about 11%. At 10% a trade, the same streak costs about 65% and needs a gain of roughly 187% to recover. Same strategy, same bad luck, completely different outcome. Only the position size changed.
How many stocks is enough?
Spreading money across more stocks does not change your average result much, but it shrinks the bad ones. We tested this by building thousands of random equal-weight baskets from the same 44 stocks, holding each for 12 months from every possible start date between 2016 and 2026.
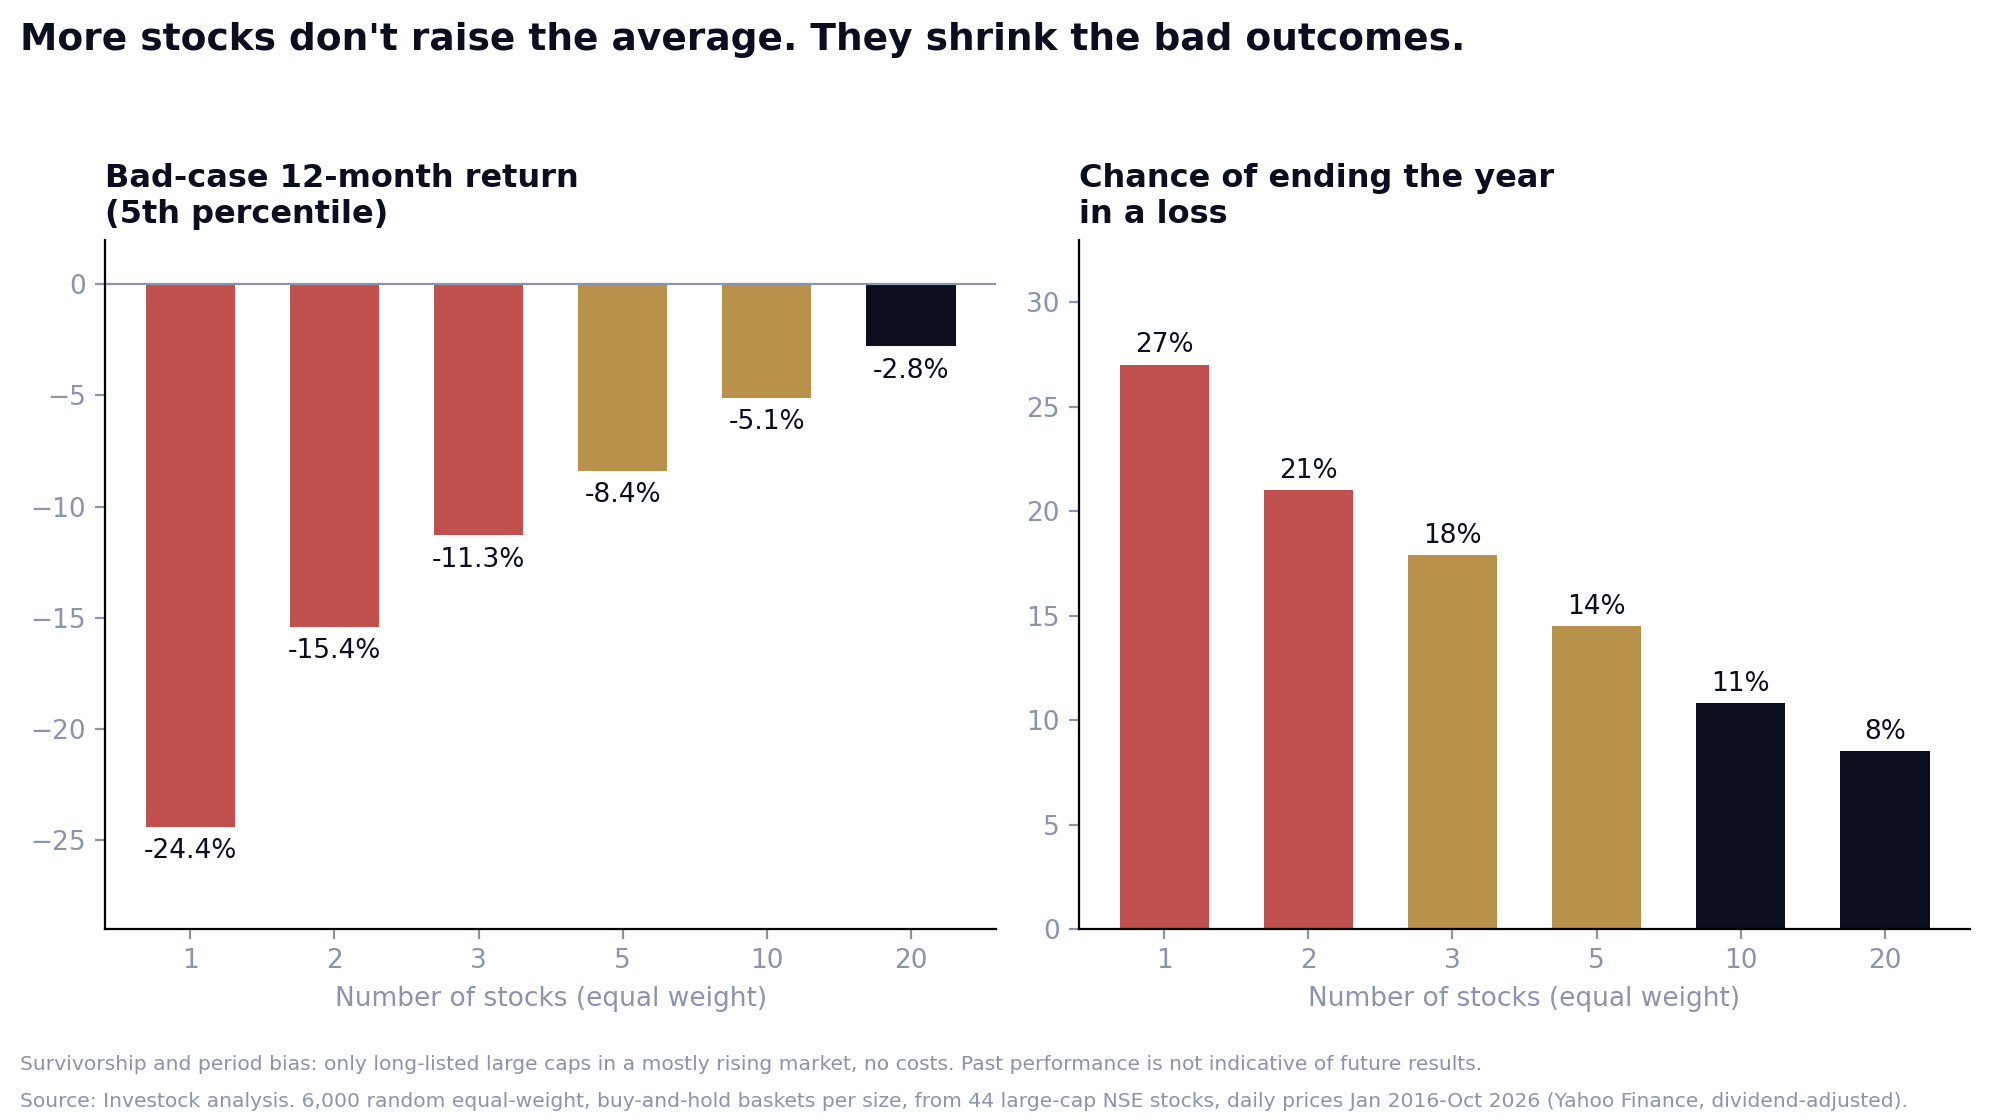
| Number of stocks | Bad-case 12-month return (5th percentile) | Chance of ending the year in a loss | Chance of losing more than 20% |
|---|---|---|---|
| 1 | -24.4% | 27% | 7.0% |
| 3 | -11.3% | 18% | 1.7% |
| 5 | -8.4% | 14.5% | 1.3% |
| 10 | -5.1% | 10.8% | 0.6% |
| 20 | -2.8% | 8.5% | 0.5% |
Source: Investock analysis. 6,000 random equal-weight, buy-and-hold baskets per size from 44 large-cap NSE stocks, Jan 2016 to Oct 2026. The typical (median) 12-month result was similar across sizes, so diversification here reduced the bad outcomes rather than lifting the average.
Two cautions. Our stock list is made up of long-listed large caps in a mostly rising decade, so the results flatter every basket size. And researchers disagree on how many stocks are enough. Evans and Archer (1968) saw little benefit beyond about 10 stocks. Statman (1987) argued for 30 to 40. An AAII analysis found 25 stocks removed about 80% of diversifiable risk and 100 stocks about 90%. An IIM Ahmedabad paper on Indian stocks (Raju and Agarwalla, 2021) estimated that 40 to 50 stocks are needed to cut diversifiable risk by 90% with 90% confidence, and called 15 to 20 likely inadequate.
The shape of the answer is the same everywhere: the first handful of stocks do the most work, and each extra one helps less. For a small account the practical limit is not theory but cost and whole-share rounding, which we turn to next.
Four ways to size a position
| Method | How it works | Strength | Watch out for |
|---|---|---|---|
| 1. Equal weight | Same rupee amount in each stock | Simple. A well-known study (DeMiguel, Garlappi and Uppal, 2009) found none of 14 optimised models consistently beat equal weighting out of sample. | Ignores how volatile each stock is. Whole-share rounding breaks it in small accounts. |
| 2. Fixed-fractional risk | Shares = (account x risk %) ÷ (entry - stop). Many people use 1% to 2% as a rule of thumb. | Ties position size to the loss you accept. | Needs a stop. A gap can take the price past your stop, so the loss can be bigger. |
| 3. Volatility-based | Shares = (account x risk %) ÷ a volatility measure such as ATR. Zerodha Varsity's example uses 2% of Rs 5 lakh divided by an ATR of Rs 76, about 131 shares. The Turtle traders used 1% of the account. | Gives smaller positions to jumpier stocks automatically. | ATR looks backwards. Needs a little more maths. |
| 4. Kelly or conviction tiers | Bigger bets when you believe you have a bigger edge. Kelly% = W - (1 - W) ÷ R, where W is the win rate and R the average win-to-loss ratio. | Mathematically elegant. | Needs a long, reliable trade history. Full Kelly bets can be very large, and Zerodha Varsity and research by MacLean, Thorp and Ziemba both warn of its short-term risk. Many practitioners use only a fraction. Not for beginners. |
Sources: DeMiguel et al., Review of Financial Studies (2009); Zerodha Varsity; MacLean, Thorp and Ziemba (2010). The 1% to 2% range is a common rule of thumb, not a SEBI rule.
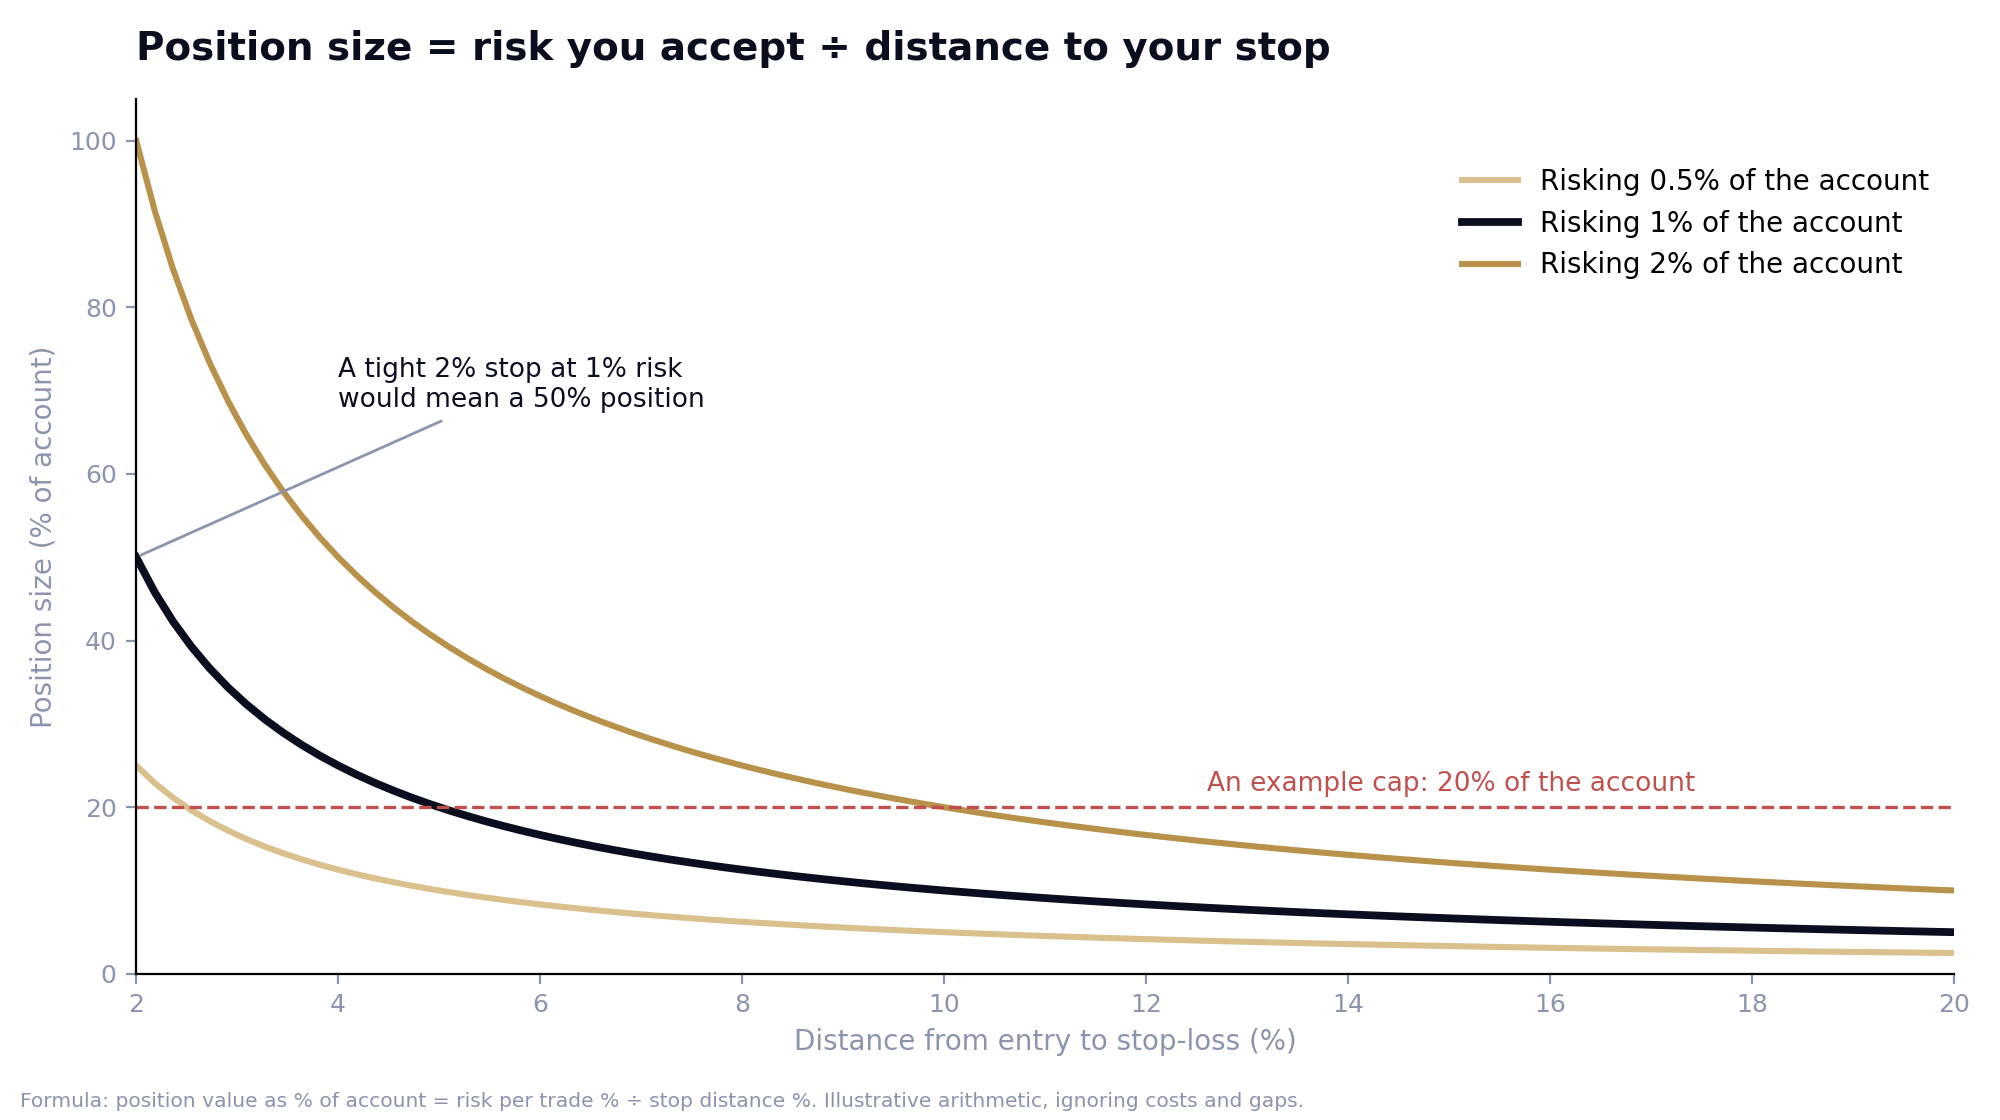
Method 2 is the one most useful to a small account, because it forces you to decide the stop first. The picture below shows how it works: the same risk gives a bigger position as your stop gets tighter.
A worked example: a Rs 1 lakh account
Say you accept losing 1% of your account on one trade (Rs 1,000), you are looking at an illustrative stock at Rs 500, and you decide to cap any single position at 20% of the account (Rs 20,000). The number of shares depends on where your stop is:
| Stop-loss | Distance | Shares allowed by 1% risk | Position by risk | Final shares (20% cap) | Position | Loss if the stop is hit |
|---|---|---|---|---|---|---|
| Rs 490 | 2% | 100 | Rs 50,000 (50%) | 40 | Rs 20,000 (20%) | Rs 400 (0.4%) |
| Rs 470 | 6% | 33 | Rs 16,500 (16.5%) | 33 | Rs 16,500 (16.5%) | Rs 990 (1.0%) |
| Rs 450 | 10% | 20 | Rs 10,000 (10%) | 20 | Rs 10,000 (10%) | Rs 1,000 (1.0%) |
| Rs 425 | 15% | 13 | Rs 6,500 (6.5%) | 13 | Rs 6,500 (6.5%) | Rs 975 (1.0%) |
Illustrative stock, not a recommendation. Shares are rounded down to whole shares. Ignores costs and gaps.
The same 1% risk produces positions from 6.5% to 20% of the account. The key lesson is counter-intuitive: a tight stop does not make a trade safer. It makes your position bigger. A position cap stops that.
Remember that a stop is a plan, not a guarantee. If a stock gaps down overnight, you can be exited well below your stop, so the loss can exceed the amount you planned to risk.
Small-account traps
1. Fixed costs hit tiny positions hardest
Most of the cost of delivery trades is a percentage (securities transaction tax of 0.1% on both buy and sell, plus stamp duty and exchange charges). But there is also a flat depository (DP) charge each time you sell a stock. At Zerodha it is Rs 15.34 per stock per day, and other brokers charge a similar or higher amount.
| Position size | Round-trip cost (rupees) | As % of the position |
|---|---|---|
| Rs 2,000 | Rs 19.79 | 0.99% |
| Rs 5,000 | Rs 26.46 | 0.53% |
| Rs 10,000 | Rs 37.59 | 0.38% |
| Rs 25,000 | Rs 70.96 | 0.28% |
| Rs 50,000 | Rs 126.58 | 0.25% |
Illustrative delivery trade, buy and sell, at a discount broker with zero delivery brokerage, using Zerodha's published charges (STT 0.1% each side, stamp duty 0.015% on buy, NSE charge, SEBI fee, 18% GST on charges and the Rs 15.34 DP charge on sale). Your broker's charges will differ.
A Rs 2,000 position needs to gain about 1% just to break even. Splitting Rs 50,000 into twenty positions of Rs 2,500 would multiply that drag, so cost is one reason small accounts cannot diversify without limit.
2. India has no fractional shares
You can only buy whole shares on NSE and BSE, so exact weights are impossible. Say you have Rs 1 lakh, want ten equal positions and keep 5% in cash. Your target is Rs 9,500 a stock:
- A stock at Rs 3,760: you can buy 2 shares, which is Rs 7,520, about 21% below target.
- A stock at Rs 8,980: you can buy 1 share, which is Rs 8,980.
- A stock at Rs 15,000: you cannot buy even one share within your target.
Some shares are very expensive. MRF traded around Rs 1.15 lakh a share in April 2026, which is more than a Rs 1 lakh account in total. Check the arithmetic before you pick the stock, not after.
3. A small account has few shots
A Rs 50,000 account cannot absorb many mistakes, and a Rs 10,000 loss feels very large. This is why fixing a maximum loss per trade, and a maximum size per position, is even more important for a small account than for a large one.
F&O: defined risk is not small risk
Derivatives make the sizing problem sharper, because contracts come in fixed lots. Under SEBI's October 2024 rules, an index derivative's contract value must be Rs 15 lakh to Rs 20 lakh at introduction and review. After the January 2026 revision, the Nifty lot is 65 units, the Bank Nifty lot is 30 and the Sensex lot is 20. At a Nifty level of about 22,550, one Nifty lot represents roughly Rs 14.7 lakh of exposure.
- Futures,margin for one Nifty futures lot is, by a third-party estimate, around Rs 1.3 lakh (roughly 9% of the contract value). That would absorb most of a Rs 1 lakh to Rs 2 lakh account. This is illustrative only, so check your broker's margin calculator.
- Buying options,the premium you pay is your maximum loss. A lot bought at a Rs 100 premium costs Rs 6,500 (65 units), which is 6.5% of a Rs 1 lakh account.
- Spreads,a spread caps your loss, but the cap can still be large for a small account. An illustrative Nifty spread with a maximum loss of Rs 20,000 a lot is 20% of a Rs 1 lakh account, 10% of Rs 2 lakh and 4% of Rs 5 lakh. Against a rule of risking 1% (Rs 1,000 on Rs 1 lakh), that is twenty times your budget.
The lesson is to size by maximum loss, not by margin. If the smallest tradable unit already breaks your risk budget, the right answer may be to skip the trade.
SEBI's studies show how this plays out. In FY26, 87.7% of individual F&O traders lost money, with an average loss of about Rs 1.17 lakh. As reported, about 78% of those traders held equity portfolios below Rs 1 lakh, and that group accounted for 51% of F&O turnover but 70% of the losses.
Seven sizing mistakes
- Sizing by excitement,the biggest position goes to the loudest tip or the most exciting idea. Size should follow your risk rule, not your emotions.
- Sizing by available cash,'I have Rs 50,000, so I will buy 100 shares' sizes the trade by your wallet, not by what you can afford to lose.
- Averaging down without a limit,doubling a position as it falls makes your biggest bet at the worst moment. Decide your maximum exposure to a stock before you buy the first share.
- A tight stop with a big size,as the chart showed, a tight stop makes the position grow. Always add a cap.
- Ignoring correlation,five stocks from one sector can behave like one big position.
- Letting positions drift,a winner can silently grow into an oversized bet. Check weights on a fixed day.
- Trading bigger after a loss,raising size to win money back is the fastest way to turn a setback into a crisis.
Build your own sizing rule in six steps
- Decide the loss you will accept on one trade. Many people use between 0.5% and 2% of the account. This is a rule of thumb, so pick a number you can live with after a bad run.
- Decide the largest share of your account any one position may take, for example 10% to 20%.
- Decide roughly how many positions your costs and share prices can support. Use the equal-weight check in the calculator.
- Set the stop before you buy. Quantity = (account x risk %) ÷ (entry price - stop price).
- Round down to whole shares and compare the result with your cap. Use the smaller number.
- Write the rule down and review your weights on a fixed day, such as once a week or month.
To save you the arithmetic, we built a free Position Size Calculator (an Excel file that also works in Google Sheets). Enter your account size, risk percentage, entry and stop, and it shows the shares to buy, the position size and the loss if the stop is hit. A second sheet checks whether whole-share rounding spoils your equal weights.
Download the Position Size Calculator
How Investock thinks about position sizing
We build sizing into the process instead of leaving it to emotion. Model Portfolio entries start at equal weights, and subscribers receive exact quantities for their capital. New entries happen on one fixed day, and every call comes with defined risk. These rules do not prevent losses. They are designed to make sizing consistent, so a single idea cannot quietly become the whole portfolio.
Related reading
- Market down 8 weeks in a row: what history says and what you can do
- RBI policy day explained: what the repo rate means for your money
Frequently asked questions
What percentage of my account should I put in one stock?
There is no single right answer. Common rules of thumb include risking 1% to 2% of the account on a trade and capping any one position at a fixed share of the account, such as 10% to 20%. Choose numbers you can live with after a bad run, and write them down.
How many stocks should a small account hold?
Research ranges from about 10 stocks to 40 or 50 for a high degree of diversification, and more stocks always help a little. A small account is limited by flat fees and whole-share rounding, so many investors settle on somewhere between a handful and a dozen or so positions. Use the calculator to test what your costs allow.
What is the 1% rule in trading?
It means risking no more than about 1% of your account on any single trade. You work out the shares to buy from that: shares = (account x 1%) ÷ (entry price - stop price). It is a rule of thumb, not a regulation.
Does a stop-loss guarantee my loss is limited?
No. If a stock gaps down overnight, your order can be executed far below your stop, so the loss can exceed what you planned. Defined-risk option spreads cap the maximum loss, but the cap can still be large for a small account.
Can I trade F&O with Rs 1 lakh?
This article cannot advise you personally. Index lots are large (one Nifty lot is about Rs 14.7 lakh of exposure), margin for one futures lot can absorb most of a Rs 1 lakh account, and SEBI's studies show most individual F&O traders lose money. If the smallest unit breaks your risk budget, size down or skip it.
What is the difference between position sizing and diversification?
Position sizing is how much money you put into each idea. Diversification is how many different ideas you hold. You need both: ten equal positions in one sector is still one big bet.
Sources
- Simulation and drawdown analysis: Investock analysis of dividend-adjusted daily prices for 44 large-cap NSE stocks and the Nifty 50, Jan 2016 to Oct 2026 (Yahoo Finance). Survivorship bias applies.
- Position-sizing methods: Zerodha Varsity (Position Sizing chapters and Kelly's Criterion); DeMiguel, Garlappi and Uppal, Review of Financial Studies (2009); MacLean, Thorp and Ziemba, 'Good and bad properties of the Kelly criterion' (2010); TurtleTrader.com (recovery table).
- Diversification: Evans and Archer, Journal of Finance (1968); Statman, JFQA (1987); AAII Journal, Burnside (July 2004); Raju and Agarwalla, IIM Ahmedabad working paper (23 Feb 2021).
- SEBI studies on individual F&O traders (FY25 and FY26) as reported by Business Standard, Moneylife, Morung Express and Outlook Business. Please confirm against SEBI's own publication.
- Charges: Zerodha charges page (fetched 9 Oct 2026); other broker pages for DP charges.
- Lot sizes and contract value: SEBI circular of 1 Oct 2024; NSE circular of 3 Oct 2025 on revised lot sizes as reported by Zerodha, Angel One, Sahi and Kotak Neo; Nifty level of about 22,556 (5 Oct 2026 close).
- No fractional shares in India: Zerodha Z-Connect and Business Standard on SEBI and MCA discussions. MRF price: Rupeezy (April 2026).