Why KOSPI Crashed 7.6% and the Nikkei 4.8%: The Numbers Behind Asia's Chip Rout
KOSPI fell 7.56% and the Nikkei about 4.8% on 15 Oct. See why, what happened to Bitcoin, gold, silver and India, and what to watch next.
On 15 October 2026, South Korea's KOSPI lost 7.56% in a single session, about 455 points. Japan's Nikkei 225 fell roughly 4.8%. SK Hynix dropped about 11% and Advantest about 15%. In India, the Sensex and Nifty rose about 1.7% and 1.5% over the same session.
Same planet, same day, opposite directions. This guide explains what triggered the fall, why Korea took the worst of it, what happened to Bitcoin, Ether, gold and silver, and what the history says comes next. Every claim comes with a number.
Written on 15 October 2026 using the data available that day. Some figures are intraday or press-reported and are marked as such. Educational content, not investment advice.
- KOSPI fell 7.56% to about 5,554, one of the 20 worst days since 1996 (16th, by our count). Trading hit a Level-1 circuit breaker at 12:38 KST, the 10th this year and the first since 29 July, as reported.
- KOSPI is about 40% below its June high and has had 21 days of falls of 5% or more in 2026, against one such day in 2025.
- The Nikkei fell about 4.8%, its second-worst day of 2026. Advantest fell about 15%, SoftBank Group about 10% and Tokyo Electron about 8%.
- Three triggers hit at once: US September CPI of 3.7% against 3.6% expected (the 10-year Treasury yield closed near 5.19%), fear about how AI spending is financed (CoreWeave's 2032 bonds yielded about 15%), and a memory-chip supply worry in a market where Samsung and SK Hynix are about half the index.
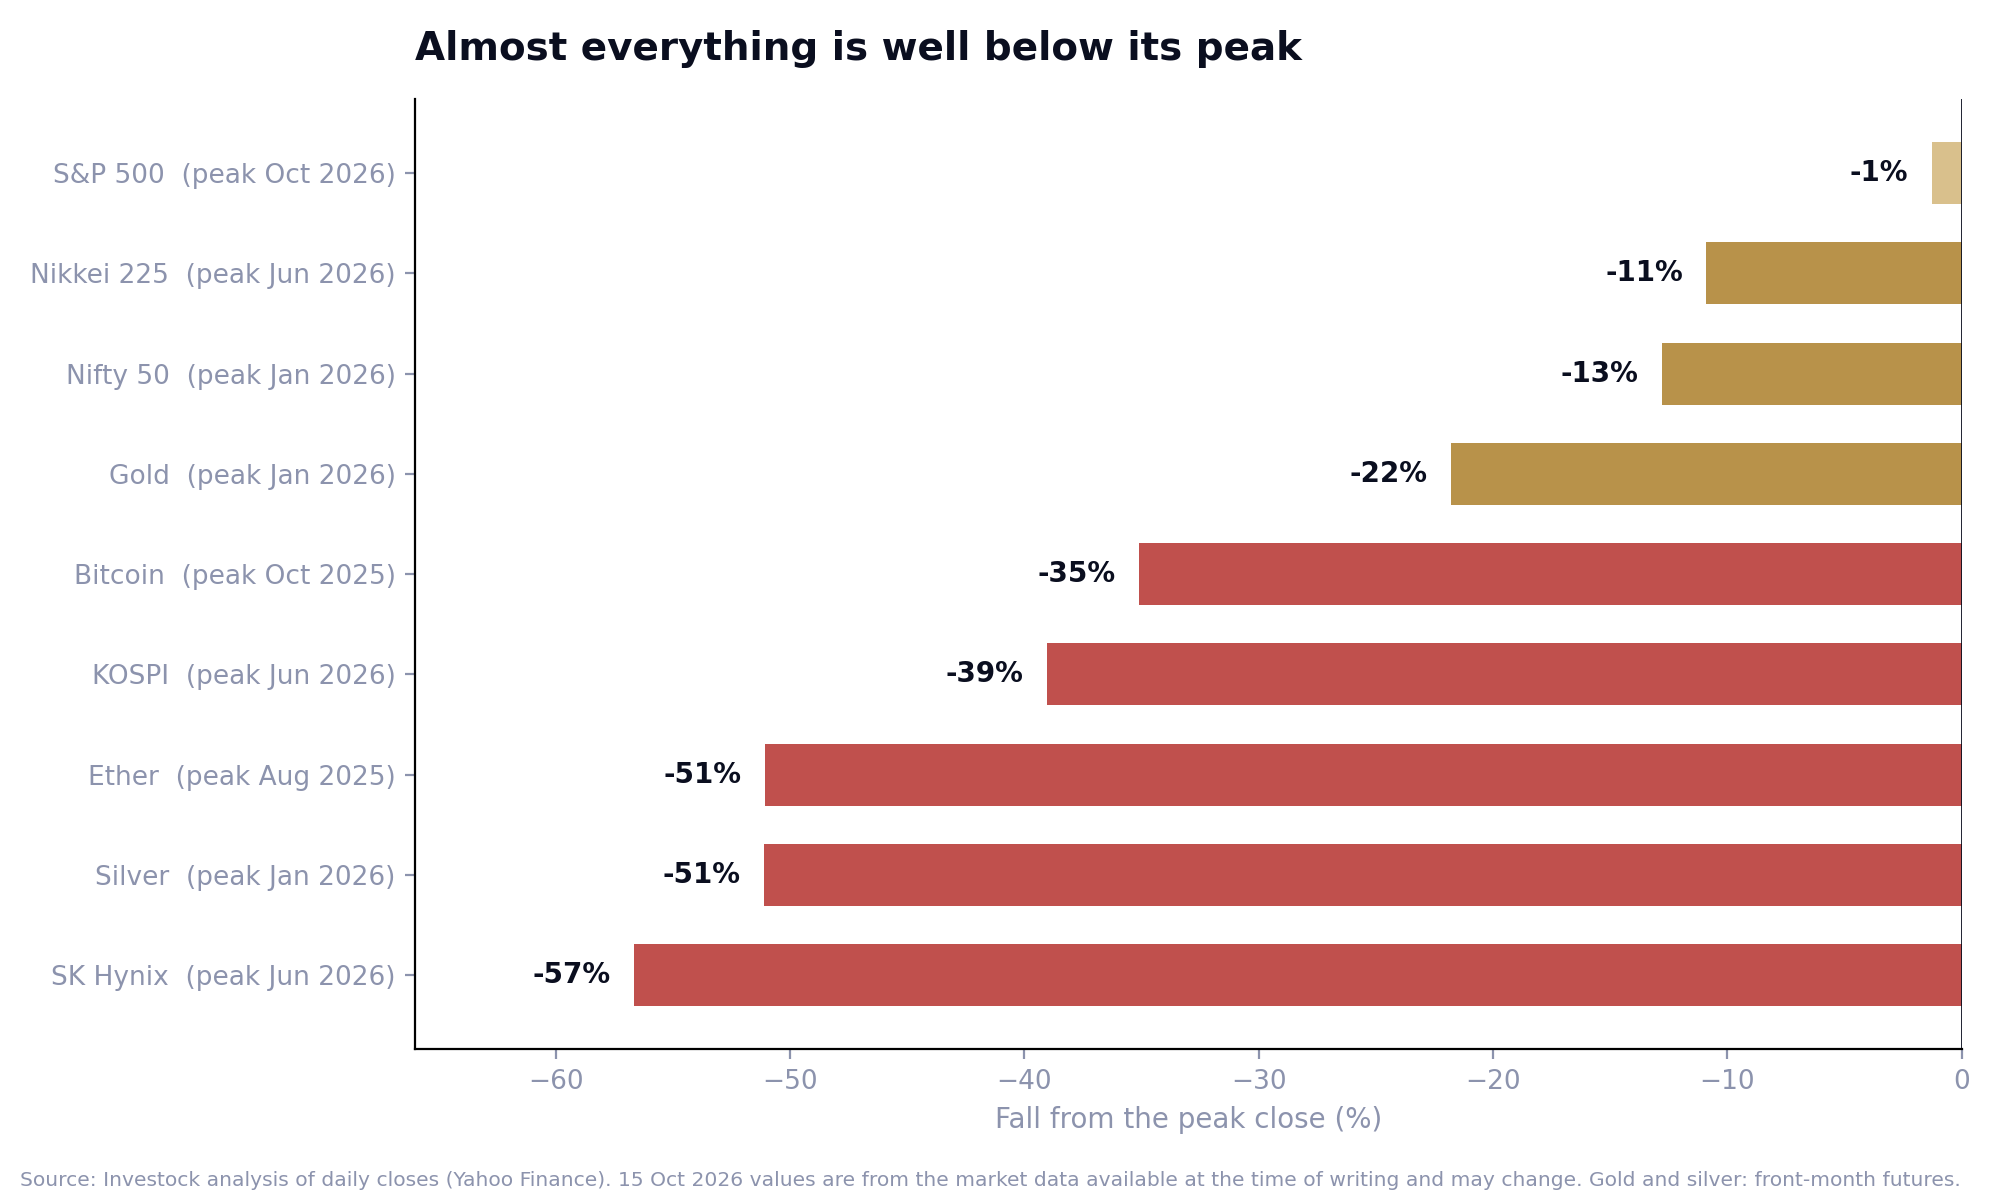
- The damage is concentrated in chips: SK Hynix is 57% below its June peak, Samsung 42%, and the US semiconductor index 20%.
- Bitcoin is about $81,000 (35% below its October 2025 peak) and Ether about $2,360 (51% below its August 2025 peak). Crypto liquidations were about $483 million in 24 hours, about 39 times smaller than the roughly $19 billion of October 2025.
- This was not a classic flight to safety. Gold fell 1.2% to 1.6% and silver about 6% on 14 October as the dollar and yields rose.
- After past one-day KOSPI falls of 7% or more, the next month was close to a coin flip: median return -0.2%, positive 46% of the time (24 events since 1997).
The scoreboard: one day, opposite directions
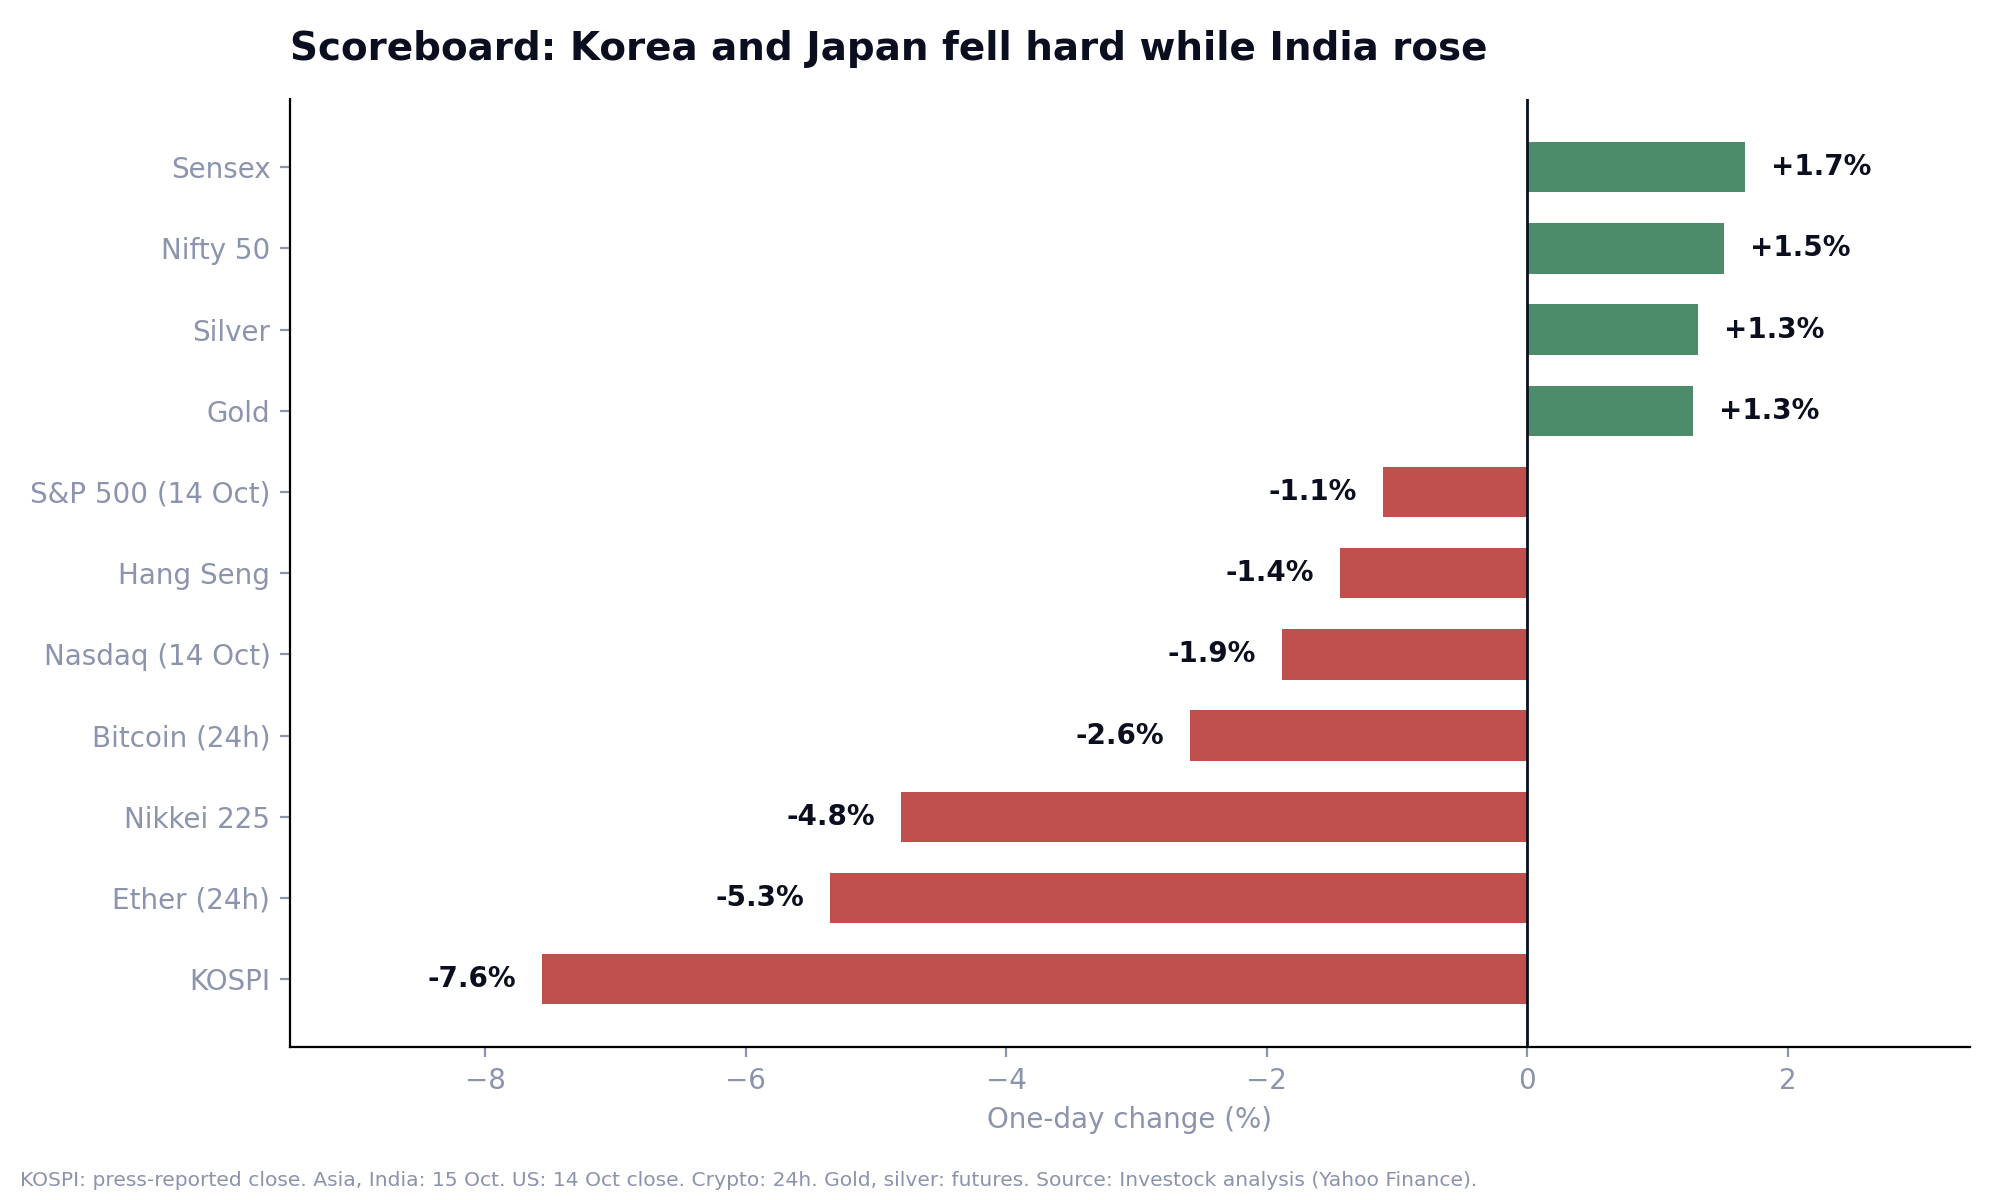
| Market | Move | Level | Note |
|---|---|---|---|
| KOSPI (Korea) | -7.56% | about 5,554 | Prior close 6,008.81. Intraday low about -9%. |
| Nikkei 225 (Japan) | about -4.8% | about 64,430 to 64,485 | Day low 64,092.74 (-5.39%). Press close and Yahoo data differ slightly. |
| Hang Seng | -1.4% | about 23,960 | |
| S&P 500 (14 Oct) | -1.11% | 7,718.94 | Fifth loss in six days. |
| Nasdaq Composite (14 Oct) | -1.88% | 26,692.87 | Worst day since 23 July. |
| Philadelphia Semiconductor Index (14 Oct) | -4.3% | about 11,684 | Sixth straight loss. |
| Nifty 50 / Sensex (15 Oct) | about +1.5% / +1.7% | about 22,965 / 73,998 | At the time of writing; closes may differ. |
| Bitcoin (24h) | about -2% to -3% | about $81,000 | Support zone $80,000 to $81,500 (Glassnode). |
| Ether (24h) | about -5% to -6% | about $2,360 | |
| Gold (15 Oct) | about +0.7% to +1.3% | about $4,130 to $4,160 | 14 Oct: -1.2% to -1.6%, third straight loss. |
| Silver (15 Oct) | about +0.8% to +1.3% | about $56 | 14 Oct: about -6%. |
Sources: press reports (Reuters, AP, JoongAng Daily, Seoul Economic Daily, CoinDesk, Kitco) and Investock analysis of Yahoo Finance data. Figures marked 'about' differ slightly between sources and times.
Why it happened: three triggers at once
There was no single company event and no export curb, tariff or central-bank surprise in the reporting we found. A stack of three things landed together.
1. Hot US inflation pushed yields and rate-hike bets up
On 14 October, US September CPI came in at 3.7% a year, against 3.6% expected and 3.4% in August. Monthly headline inflation was +0.6%, and core was 2.6% against 2.5% expected, driven mostly by gasoline and energy. The 10-year Treasury yield closed near 5.19% and touched about 5.32% during the day, against about 4.05% a year ago. The dollar index rose to about 102.5, an 18-month high by one report, against 98.8 a year ago.
Markets then repriced the odds of a Fed rate hike on 28 October from about 22% before the data to somewhere between roughly 30% and 55% depending on the source and the hour. The Fed funds range is 3.75% to 4.00% after a hike in September. As Saxo's Charu Chanana framed it, this was a repricing of the cost of capital rather than a break in tech fundamentals.
2. Fear about how AI spending is financed
On the same day, Gartner warned that more than $3.5 trillion of AI infrastructure spending could be impaired by 2030, and that over 80% of 'neocloud' providers could fail. CoreWeave's 2032 bonds hit a yield of about 15% and its shares fell 15.5%. Oracle fell between 7% and 9%. Two days earlier, Broadcom's CEO had said access to capital could limit AI expansion, and the KOSPI fell 3.65% that day. By the close on 14 October, the semiconductor index had lost 4.3%, its sixth straight daily loss and its longest losing run since May 2025.
3. A Korea-specific memory worry
On 10 October, China's CXMT outlined a new DRAM design with server DDR5 expected by the end of 2026, feeding fears of a memory supply glut. That matters in Korea, where Samsung Electronics and SK Hynix are about half of the KOSPI by market value (the Financial Times, as quoted by a broker report). In September, foreign investors sold a net 21.5 trillion won of KOSPI stocks and Samsung plus SK Hynix were about 77% of that. JPMorgan's Mixo Das also noted that with the companies' buybacks finished, the market lacked a new marginal buyer.
Leverage added fuel. A leveraged semiconductor ETF in the US (Direxion's SOXL) fell 13.35% on 14 October, and Korean retail investors hold many leveraged single-stock and sector products. On 15 October, retail investors bought about 1.2 trillion won of stocks by midday, while foreigners sold about 2.9 trillion won, the eighth straight session of net foreign selling.
The timeline
| Date | Event | Number |
|---|---|---|
| 8 Oct | Samsung's Q3 preliminary results | Operating profit about 107.4 trillion won |
| 10 Oct | CXMT outlines new DRAM design | Server DDR5 targeted by end-2026 |
| 12 Oct | Broadcom CEO warns on capital access | KOSPI -3.65% to 6,384 |
| 13 Oct | Korea sell-off, sell sidecar at 09:47 | KOSPI -5.46% to 6,035; SK Hynix -10.1% |
| 14 Oct | US CPI; Gartner warning; CoreWeave bonds | S&P -1.11%, Nasdaq -1.88%, SOX -4.3% |
| 15 Oct, 09:00 KST | KOSPI opens sharply lower | 5,673 (-5.59%) |
| 15 Oct, 09:07 KST | Sell sidecar (5-minute programme-selling halt) | Kosdaq sidecar at 09:12 |
| 15 Oct, 12:23 KST | Kosdaq Level-1 circuit breaker | 757.88 (-8.01%) |
| 15 Oct, 12:38 KST | KOSPI Level-1 circuit breaker (20-minute halt) | 5,528 (-8.00%) |
| 15 Oct, close | KOSPI and Nikkei close | KOSPI -7.56%; Nikkei about -4.8% |
Sources: Korea JoongAng Daily, Seoul Economic Daily, Reuters, AP, Yahoo Finance as reported. Sidecar: programme selling halts for 5 minutes when KOSPI 200 futures fall 5% or more for a minute. Circuit breaker: all trading halts for 20 minutes (plus a 10-minute call auction) when the index is down 8% for a minute.
Inside the KOSPI crash
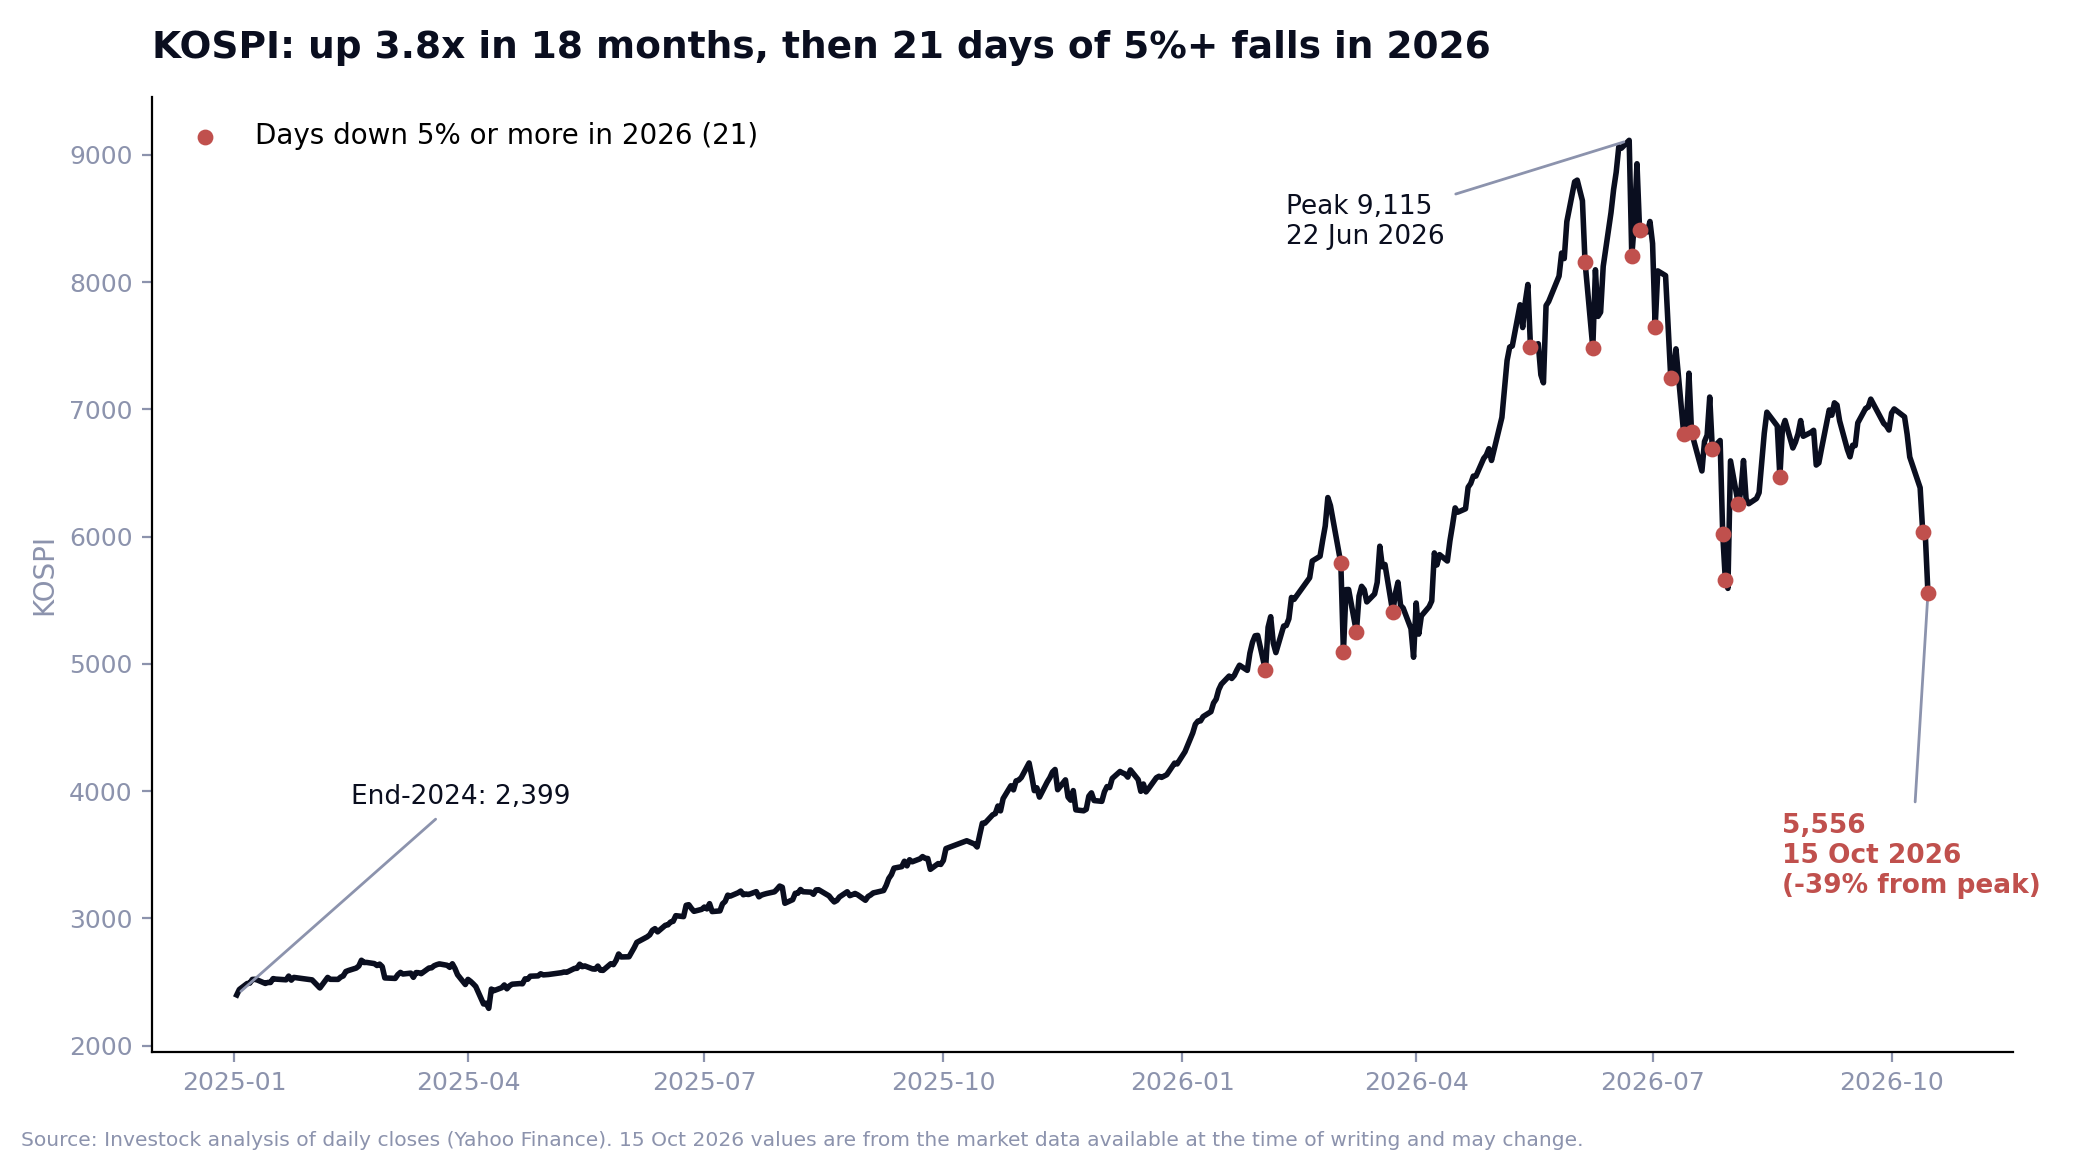
The KOSPI rose from 2,399 at the end of 2024 to 4,214 at the end of 2025, a gain of 76%, and then to a closing high of about 9,115 on 22 June 2026 (some reports quote a record near 9,386, probably an intraday figure). That is 3.8 times its end-2024 level. At 5,554, it is about 39% to 41% below the June high, but still up about 32% for 2026 and 2.3 times its end-2024 level.
The path down has been violent. In 2026 the KOSPI has had 21 days of falls of 5% or more. In 2025 it had one, in 2024 one, and in 2020 two. Its 30-day annualised volatility is about 40%, against about 21% in 2025 and a long-run average of about 27%. Today's fall is the seventh worst of 2026 by our count.
| Rank | Date | KOSPI fall |
|---|---|---|
| 1 | 4 Mar 2026 | -12.06% |
| 2 | 12 Sep 2001 | -12.02% |
| 3 | 17 Apr 2000 | -11.63% |
| 4 | 24 Nov 1997 | -10.95% |
| 5 | 28 Jul 2026 | -10.84% |
| 6 | 24 Oct 2008 | -10.57% |
| 7 | 23 Jun 2026 | -9.99% |
| 8 | 16 Oct 2008 | -9.44% |
| 9 | 13 Jul 2026 | -8.95% |
| 10 | 5 Aug 2024 | -8.77% |
| 16 | 15 Oct 2026 | -7.56% |
Source: Investock analysis of KOSPI daily closes since December 1996 (Yahoo Finance); 15 Oct from press-reported close. Four of the ten worst days ever have come in 2026.
Japan: the Nikkei and the chip supply chain
The Nikkei 225 closed down about 4.8% from 67,744.29, with a day low of 64,092.74 (-5.39%). It is the second-worst day of 2026 after 9 March (-5.2%), and about 11% below its June record. For context, the Nikkei's worst day in the last 36 years was 5 August 2024, at -12.4%.
Chip-related stocks led the fall: Advantest fell about 14% to 15%, Kioxia about 11%, SoftBank Group about 9% to 10% and Tokyo Electron about 7% to 8%, as reported. The yen was steady at about 158 per dollar. The Bank of Japan's policy rate is reported at 1.25% after a September hike, and the BOJ meets on 29 and 30 October.
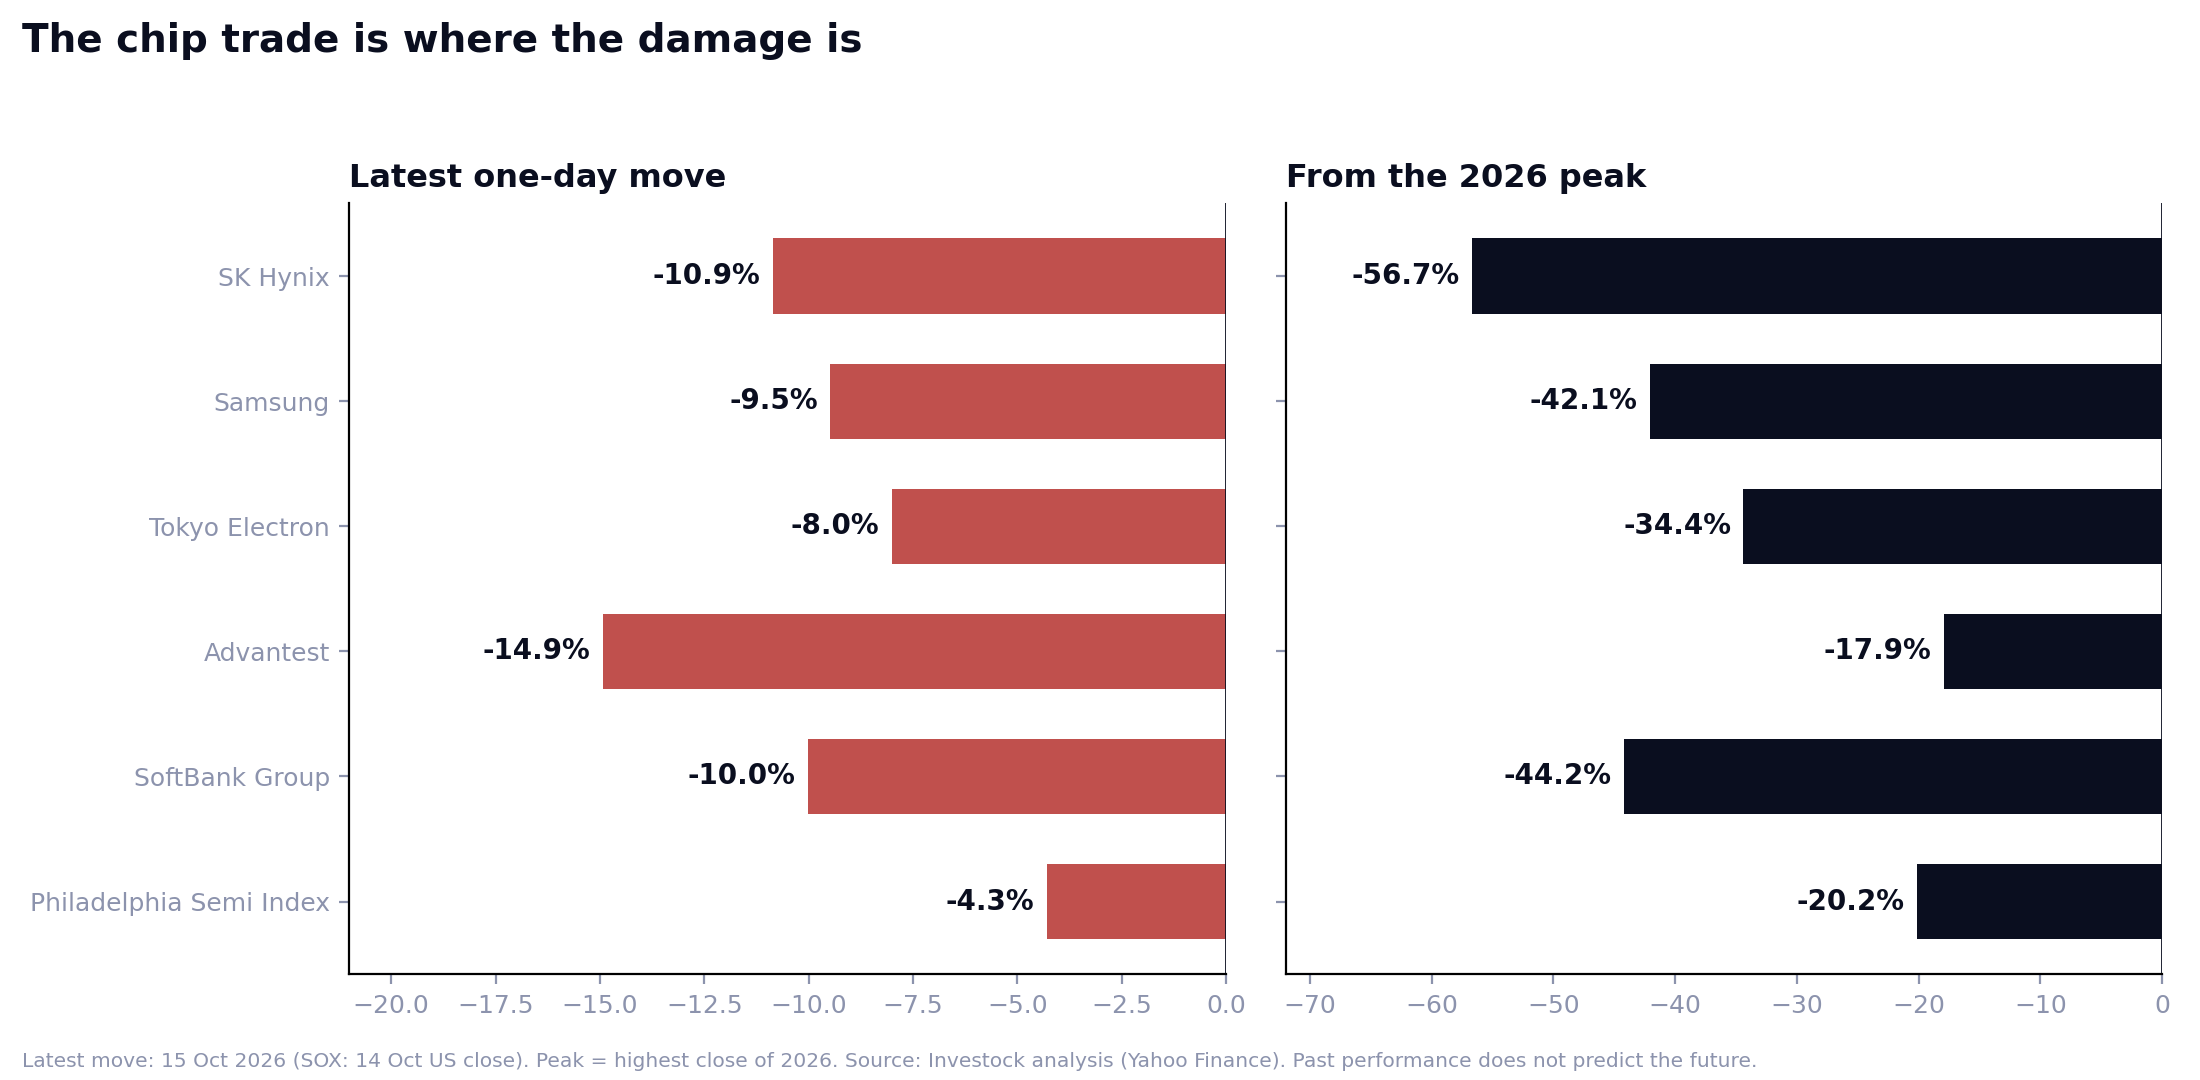
| Stock or index | Latest one-day move | From 2026 peak | Peak date |
|---|---|---|---|
| SK Hynix | -10.9% | -56.7% | 22 Jun |
| Samsung Electronics | -9.5% | -42.1% | 18 Jun |
| SoftBank Group | -10.0% | -44.2% | 2 Jun |
| Tokyo Electron | -8.0% | -34.4% | 1 Jul |
| Philadelphia Semiconductor Index | -4.3% (14 Oct) | -20.2% | 22 Jun |
| Advantest | -14.9% | -17.9% | 6 Oct |
| Nvidia | -3.2% (14 Oct) | -7.5% | 6 Oct |
Source: Investock analysis of daily closes (Yahoo Finance); 15 Oct moves approximate and may differ from press-reported closes. Peaks are the highest close of 2026. These are market data, not recommendations.
Notice what is not in the table: Nvidia, the symbol of the AI trade, is only 7.5% off its high. The pain is in the memory and equipment names that rose the most. SK Hynix rose about 4.5 times from the start of 2026 to its June peak, from 651,000 won to 2,919,000 won, so a 57% fall still leaves it up about 94% for the year.
Beyond stocks: Bitcoin, Ether, gold and silver
Bitcoin and Ether
Bitcoin fell about 2% to 3% to roughly $81,000, which is about 35% below its closing peak of about $124,750 on 6 October 2025 (the intraday record was $126,198). Ether fell about 5% to 6% to about $2,360, about 51% below its August 2025 peak. The total crypto market capitalisation was about $2.76 trillion on 14 October, with Bitcoin at 59.4% of it.
Spot Bitcoin ETFs saw about $261 million of net outflows on 14 October and spot Ether ETFs about $129.5 million, per Farside data as reported. Glassnode flagged $80,000 to $81,500 as a key support zone, close to the US ETF holders' average cost of about $81,500.
Crypto liquidations were modest. About $483 million of Bitcoin and Ether futures positions were liquidated in 24 hours (Ether $286 million, Bitcoin $197 million), and about $815 million on 13 October. The October 2025 crash saw roughly $19 billion in a day, about 39 times today's figure. Funding rates had also turned slightly negative, which suggests the market was not crowded with leveraged longs.
Gold
Spot gold fell 1.2% to 1.6% on 14 October to below $4,100, its third straight daily loss, then bounced to about $4,130 to $4,160 on 15 October. It is down about 3% in a month and about 4.5% in a year. Its record was $5,594.82 on 29 January 2026, so it is about 26% below that intraday high (22% below the closing high in our data).
The reasons were the same as for Bitcoin: hot inflation data, October rate-hike odds, a stronger dollar and higher yields, plus selling by trend-following funds (TD Securities). Gold is not behaving like a safe haven in this episode because the shock is about rates, not fear of a crisis. Gold ETFs, meanwhile, took in 67.3 tonnes in September to a record 4,256 tonnes of holdings (World Gold Council, as reported).
Silver
Silver fell about 6% on 14 October to about $55.4 to $55.5 and sits near $56 on 15 October, about 11% lower in a month and still up about 3.4% on a year. Its record was $121.65 on 29 January 2026, so it is about half its peak. The gold-to-silver ratio is 73.9, against 66.5 on average over the past year and 44 at silver's January peak. CME margin hikes between December 2025 and February 2026 (to 18% effective on 6 February) preceded the earlier crash. We found no margin change linked to this week's drop.
The macro dashboard
| Indicator | Now | A year ago | Note |
|---|---|---|---|
| US 10-year yield | about 5.19% | about 4.05% | Touched about 5.32% on 14 Oct; 5.35% earlier in Oct was the highest since 2002 |
| Brent crude | about $104 to $106 | about $62 | Reported at about $72 before the Iran war began in late February |
| Dollar index (DXY) | about 102.1 to 102.5 | about 98.8 | 18-month high on 14 Oct (one report) |
| USD/JPY | about 158 | about 152 | |
| USD/KRW | about 1,342 to 1,348 | about 1,429 | Won stronger than a year ago |
| USD/INR | about 95.1 | about 88.8 | Rupee up for four sessions |
Sources: Yahoo Finance data, Reuters, CNBC and other press reports as noted. Values are approximate.
Was it a panic or a repricing?
The evidence points more to a repricing of rates and AI valuations than to forced selling across the board:
- Crypto leverage was small: $483 million liquidated in 24 hours, about 39 times below October 2025.
- Gold and bonds did not rally. Gold lost 1.2% to 1.6% and the 10-year yield rose to about 5.19%, so there was no flight to safety.
- Korea shows more forced-selling features: eight straight sessions of foreign net selling, a circuit breaker and leveraged retail products.
- Assets did not all move together over time. Over the last three months, Bitcoin's daily moves had a correlation of about 0.31 with the Nasdaq and about 0.01 with the KOSPI. The KOSPI and Nikkei, by contrast, correlated at about 0.75.
- On 13 October, Bitcoin held near $84,000 while the KOSPI fell 5.46%. It fell later, after the CPI release.
India's view: why the Nifty and Sensex rose
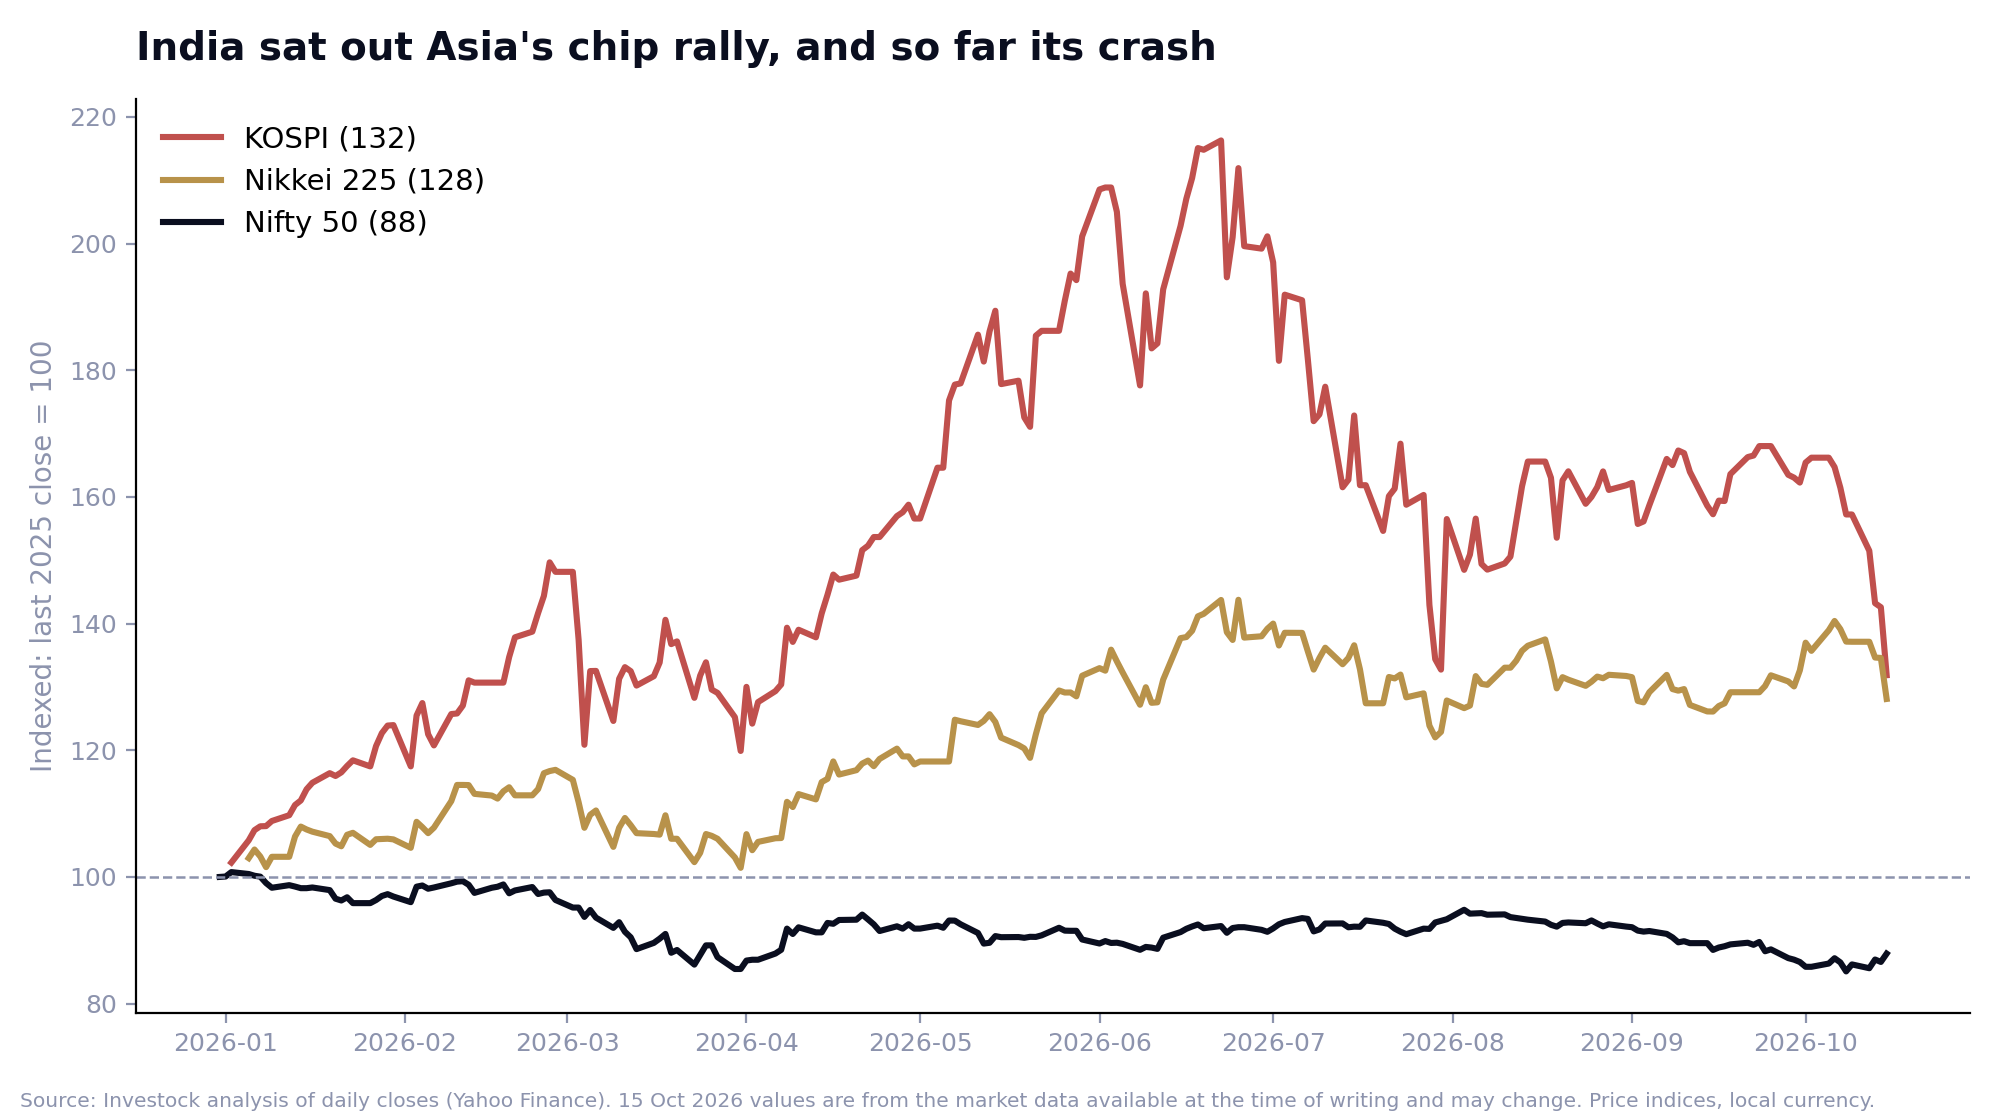
The Sensex and Nifty rose about 1.7% and 1.5% as Korea and Japan crashed. IT stocks rallied and crude eased about 1.6% to about $104, according to market reports. Foreign institutional investors were net sellers of about ₹1,857 crore on 14 October while domestic institutions bought about ₹2,670 crore.
The divergence is bigger than one day. Since the start of 2026, the KOSPI is up about 32% and the Nikkei about 28%, while the Nifty is down about 12% and the Sensex about 13%. India missed the chip rally and, so far, has missed this crash. Since January 2024, on the 23 days when the KOSPI fell 5% or more, the Nifty moved by an average of -0.5% on the same day. It ranged from -3.2% to +1.6%, so it is no shield.
Two India-specific numbers matter for commodities. The rupee is at about 95.1 per dollar, against about 88.8 a year ago. And MCX gold is about ₹1,47,500 per 10 grams and silver about ₹2,09,300 per kg, about 17% and 22% above their dollar-parity prices by our calculation. The gap is consistent with India's import duty, which reports say was raised to 15% on 13 May 2026.
What this changes: five consequences to watch
- Korea's valuation base resets. With Samsung and SK Hynix about half the index and 42% to 57% off their highs, KOSPI's direction is now mostly their direction. Foreign investors have net sold for eight straight sessions.
- AI funding gets a price tag. CoreWeave's 2032 bonds at about 15% show the cost of financing the build-out. If funding costs stay this high, the debate shifts from 'how fast can AI grow' to 'who can afford it'.
- Rates stay the swing factor. The market is pricing a meaningful chance of an October Fed hike (about 22% before CPI, 30% to 55% after, by source) with the 10-year at about 5.2%. Every rate surprise now hits stocks, crypto and metals together.
- Leveraged retail products are a stress point. Korean regulators held an emergency meeting on 15 October, and measures on leveraged products are one of the open items.
- Commodities and crypto trade on rates, not fear. Gold, silver, Bitcoin and Ether all fell on a rate shock, so their behaviour as 'hedges' is conditional on what drives the market.
What history says after big one-day falls
| After a one-day fall of... | Events | Median next day | Median after 1 week | Median after 1 month | Positive after 1 month | Median after 3 months |
|---|---|---|---|---|---|---|
| KOSPI -7% or worse (since 1997) | 24 | +1.0% | +4.6% | -0.2% | 46% | +7.0% |
| Nikkei -4.5% or worse (since 1990) | 60 | +1.5% | +3.6% | +5.1% | 70% | +5.2% |
Source: Investock analysis of daily closes (Yahoo Finance), up to 14 Oct 2026. Events cluster in 2008 and 2026, so they are not independent. In 2026, the seven KOSPI events had a median one-month return of -3.3%. Past performance does not predict the future.
Two points stand out. First, the rebound usually comes within a week: after 71% of KOSPI events the index was higher five trading days later. Second, a month later the picture is far less clear for Korea: the median was -0.2% and the range ran from -22% to +50%. In the 2026 cluster, four of the seven events had a month-later return of -3% or worse. This is a description of the past, not a forecast.
What to watch next
| Date | Event | Why it matters |
|---|---|---|
| 15 Oct | US PPI and retail sales; TSMC Q3 results (net profit NT$763.1 bn, up 68.7%, a sixth straight record, as reported) | Inflation follow-through; AI demand read-through |
| 22 Oct | Bank of Korea rate decision (policy rate 3.00%; a pause is expected) | Korea's policy backdrop |
| 27 to 28 Oct | FOMC; decision 28 Oct, 14:00 ET | Hike odds of roughly 22% to 55% (by source) |
| 29 Oct | Samsung Q3 earnings call | Memory-chip outlook |
| 29 to 30 Oct | Bank of Japan meeting | Yen and Nikkei |
| 17 Nov | Nvidia earnings (company-stated) | AI spending read-through |
Dates as reported by the sources noted in our fact-check sheet; confirm before relying on them.
How Investock thinks about falls like this
We do not predict days like this one. We build for them. Investock's Model Portfolio uses equal weights, so no single idea can quietly become the portfolio. New entries happen only on Mondays, rather than in the middle of a panic. Each position carries a predefined exit rule. None of this prevents losses, and a model portfolio can lose money. It is designed to make behaviour in a bad week the same as in a good week.
Related reading
- Market down 8 weeks in a row: what history says and what you can do
- RBI policy day explained: what the repo rate means for your money
- Position sizing for small accounts: how much to put in one stock
Frequently asked questions
Why did the KOSPI crash today?
Three things combined: a hotter-than-expected US CPI print (3.7% against 3.6%) that lifted yields and rate-hike odds, fears about financing AI spending, and a memory-chip supply worry in a market where Samsung and SK Hynix are about half the index. The index fell 7.56% and triggered a circuit breaker.
Is this like 2008 or August 2024?
In size, not yet. The KOSPI's fall of 7.56% ranks 16th since 1996 and the Nikkei's about 4.8% is far below 5 August 2024's 12.4%. What is unusual is the frequency: the KOSPI has had 21 days of falls of 5% or more in 2026.
What is a circuit breaker or a sidecar?
A sidecar halts programme selling for 5 minutes when KOSPI 200 futures fall 5% or more for a minute. A circuit breaker halts all trading for 20 minutes, plus a 10-minute call auction, when the index is down 8% for a minute.
Will India fall too?
No one can say. On the 23 days since January 2024 when the KOSPI fell 5% or more, the Nifty's same-day move averaged -0.5% and ranged from -3.2% to +1.6%. The Nifty is already down about 12% in 2026.
Why did gold and silver fall in a risk-off market?
Because this shock is about rates and the dollar rather than fear of a crisis. The dollar index hit about 102.5 and the 10-year yield about 5.19%, both of which weigh on metals that pay no yield.
Why did Bitcoin and Ether fall?
Mostly on the same rate shock. Bitcoin fell about 2% to 3% and Ether about 5% to 6%, with spot ETF outflows of about $261 million and $129.5 million on 14 October. Liquidations were about 39 times smaller than in October 2025.
Sources
- Index, stock, commodity and crypto histories and calculations (worst days, forward returns, drawdowns, correlations, volatility, index-to-2025-close comparisons): Investock analysis of daily data (Yahoo Finance) through 15 Oct 2026. 15 Oct values are as available at the time of writing.
- KOSPI and KRX events (sidecar 09:07, Level-1 circuit breaker 12:38 KST at 5,528, Kosdaq breaker, investor flows): Korea JoongAng Daily, Seoul Economic Daily, Korea Herald, Reuters via Investing.com, PANews (15 Oct 2026). KOSPI close 5,554.27 (-7.56%) per PANews and the market table.
- Nikkei and Japan: Japan Times, AP, Reuters via MarketScreener, Investing.com, PANews (15 Oct 2026); Nikkei close differs between sources (64,425.95 per PANews; about 64,485 in Yahoo data).
- US session of 14 Oct (S&P 500 -1.11% to 7,718.94, Nasdaq -1.88%, Dow, SOX -4.3%, Nvidia, Oracle, CoreWeave): AP, Yahoo Finance, Bloomberg and Reuters as reported.
- US September CPI (3.7% y/y vs 3.6% expected; core 2.6%): Yahoo Finance and Reuters, 14 Oct 2026. Yields, dollar and Fed odds: CNBC, Reuters, FXStreet, UCapital; Fed hike odds vary by source and time.
- AI financing: Gartner warning on $3.5 trillion of AI infrastructure spend; CoreWeave bond yields and shares: Yahoo Finance, AI Weekly as reported.
- Crypto: CoinDesk, Yahoo Finance, CryptoTicker, CoinCentral, TokenPost (Farside ETF flows), Glassnode via FXStreet (15 Oct 2026).
- Gold and silver: Kitco, Trading Economics, FXStreet (14 to 15 Oct 2026); record highs per Reuters; World Gold Council data via Money Metals; CME margin history as reported.
- India: HDFC Sky, India TV, Business Today, Goodreturns (MCX rates), Customs notification 15/2026 as reported; Sensex and Nifty on 15 Oct are intraday figures.