Momentum Investing in India: What DMart Shows About Winners, Rules and Exits
DMart rose 8x from listing, then lost momentum and now trades 42% below its high. What momentum investing is, how it works in India, and why exits matter.
On 28 October, DMart (Avenue Supermarts) closed at ₹3,134, its lowest level since June 2021. That is 42% below its closing high of ₹5,391 (24 September 2024), 26% lower than a year ago, and 21% below its own 200-day average. In a list of 66 large caps, its momentum now ranks in the bottom tenth. Yet the business is still growing: standalone revenue rose 18.4% in the September quarter and the company now runs 518 stores.
That gap, a growing business and a falling share price, is what momentum investing is about. Momentum is the idea that stocks which have been rising tend to keep rising for a while, and stocks which have been falling tend to keep falling, and that you can follow that without understanding why. It is one of the most studied patterns in markets, and it has two jobs: choosing what to hold, and knowing when to let go. DMart, listed in 2017 and one of India's best-known compounders, shows both jobs.
Written on 28 October 2026. Prices are Yahoo Finance closing data for 28 October, with company results as reported on 10 October. Stocks are named as market data to illustrate a method, not as recommendations. Educational content, not investment advice.
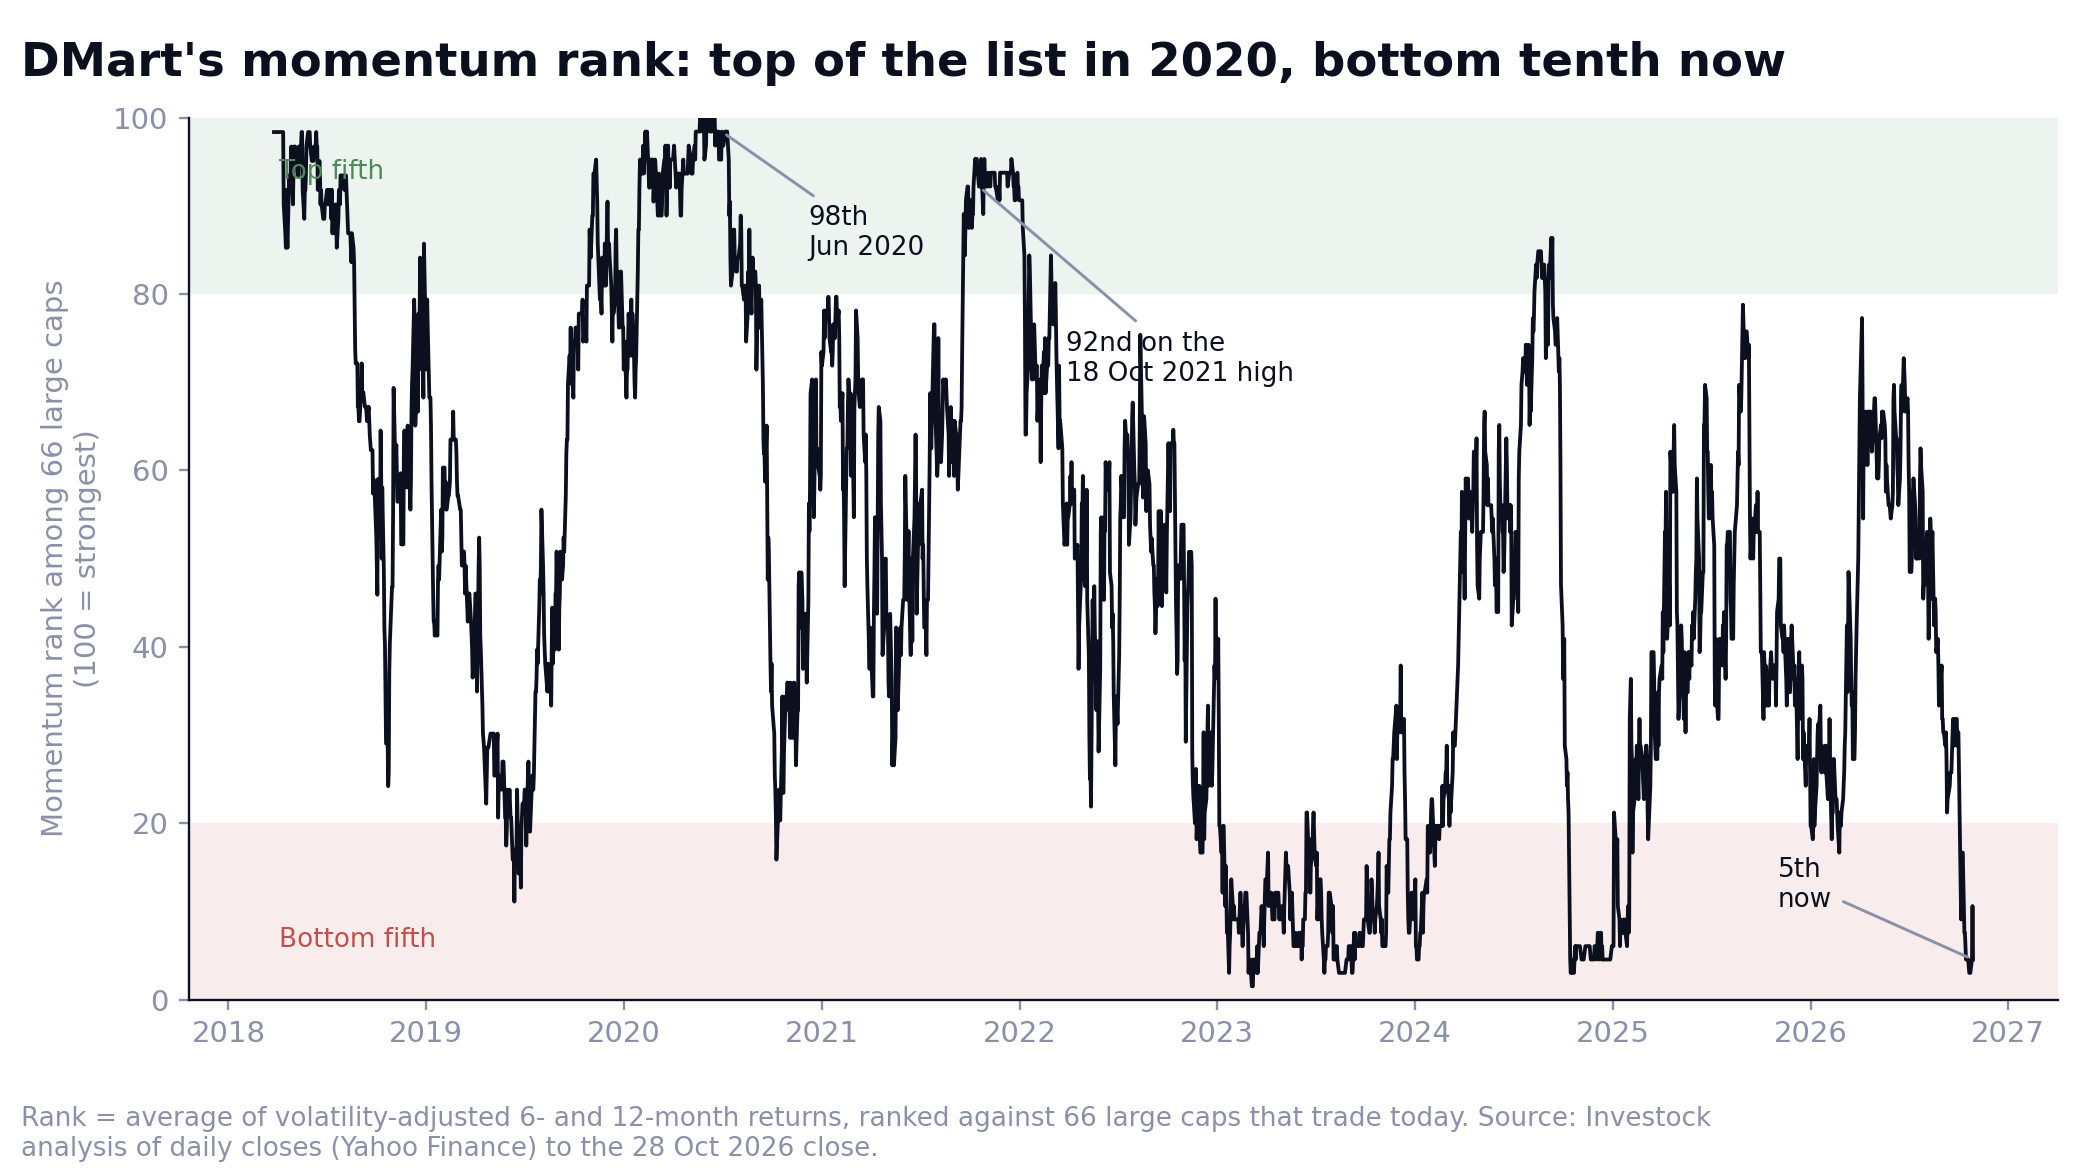
- DMart: about 10.5x from its ₹299 issue price to ₹3,134 today. Its momentum rank among 66 large caps was 98th (of 100) in June 2020 and 92nd on its 2021 high. It is 5th now (of 100), and was in the bottom fifth through much of 2023, long before today's low.
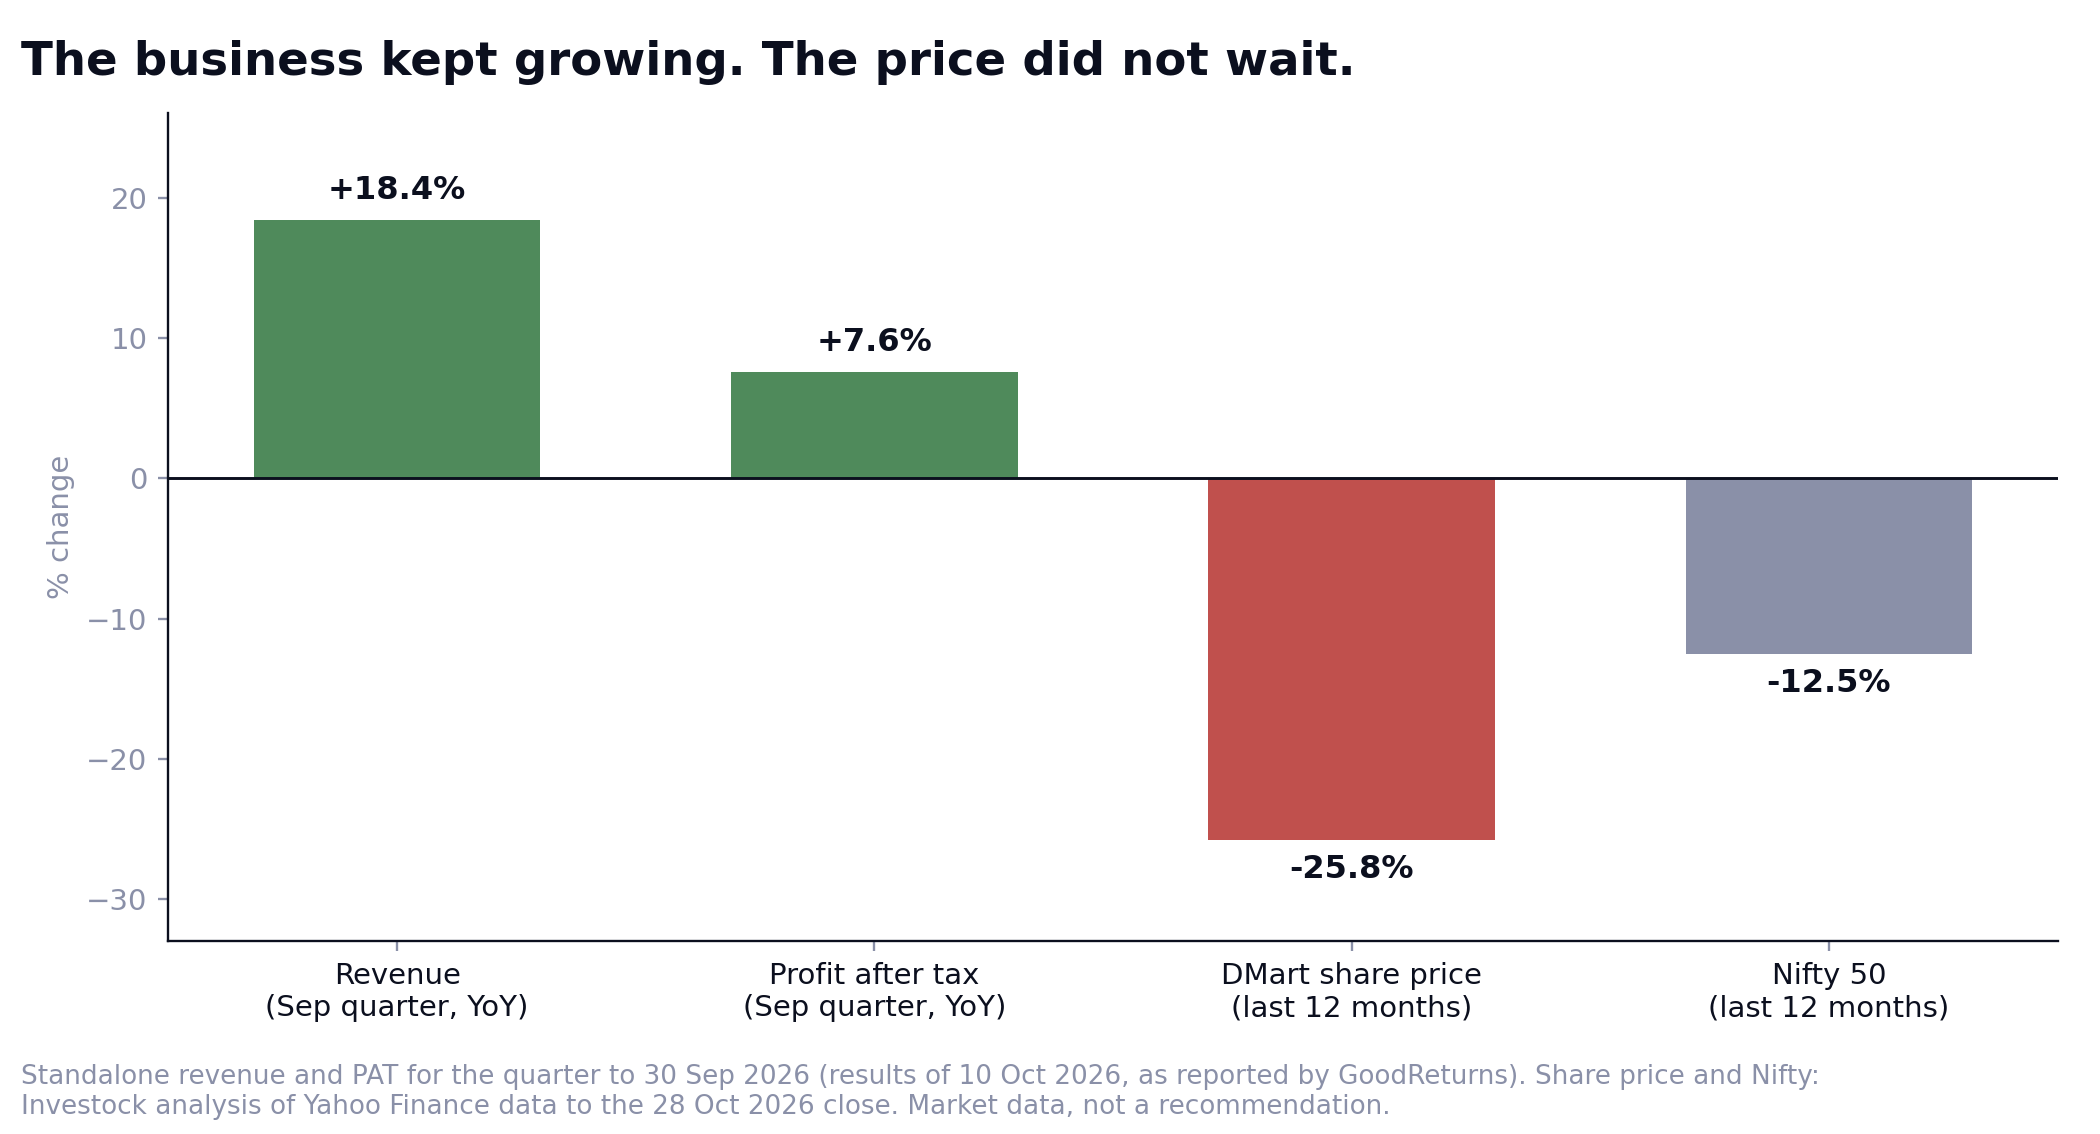
- Business and price diverge: September-quarter revenue +18.4%, profit +7.6%, same-store sales +9.5%, yet the share price is -26% in 12 months (Nifty -12%). Momentum is the market's changing view of the future, and it can turn well before the accounts do.
- Momentum is powerful: a Nifty 200 Momentum 30 ETF made +40.8% in 2023 against +21.0% for a Nifty 50 ETF, and +22.3% against +10.4% in 2024. Twice the market, two years running.
- It is a long-run edge: the NSE Nifty200 Momentum 30 index returned 18.8% a year against 13.6% for the Nifty 50 since 2005 (total return, history partly back-calculated), and beat the Nifty 50 in 15 of 21 years.
- It finds the big winners: in the three years to their peaks, Adani Enterprises rose +1,804%, Trent +626% and Eternal +472%.
- The exit is the other half: every one of those leaders later fell sharply. A rule decided in advance does the job that DMart's chart shows is hardest: leaving. That is how the Investock Model Portfolio is built.
DMart in nine years: from listing day to a five-year low
| Date | What happened | Price |
|---|---|---|
| 8 to 10 Mar 2017 | IPO opens at a price band of ₹295 to 299; subscribed about 105 times (search report) | ₹299 issue price |
| 21 Mar 2017 | Listing day: NSE opens at ₹600 (+100%) and closes near ₹641 (+114%) | ₹641.6 (Yahoo close) |
| 14 Oct 2021 | Best 12-month run in its history: +170% in a year; the next 12 months: -19% | ₹5,324 close |
| 18 Oct 2021 | All-time intraday high ₹5,899.90 (a one-day spike); the stock closed far lower | ₹4,898 close |
| 2022 to 2023 | Range-bound: closes between about ₹3,230 and ₹4,730 | ₹3,230 to 4,730 |
| 24 Sep 2024 | Closing high | ₹5,391 |
| 10 Oct 2026 | Q2 FY27 results (announced on a Saturday): revenue +18.4%, profit +7.6%. On Monday 12 Oct the stock fell 4.3% | ₹3,365 close on 12 Oct |
| 28 Oct 2026 | Closes at its lowest since 2 June 2021 | ₹3,134 close |
Sources: Investock analysis of Yahoo Finance daily closes; IPO and listing details from Business Standard and PTI reports of March 2017 (via search); results from GoodReturns (10 and 12 Oct 2026). Prices are adjusted for splits and bonuses by Yahoo Finance.
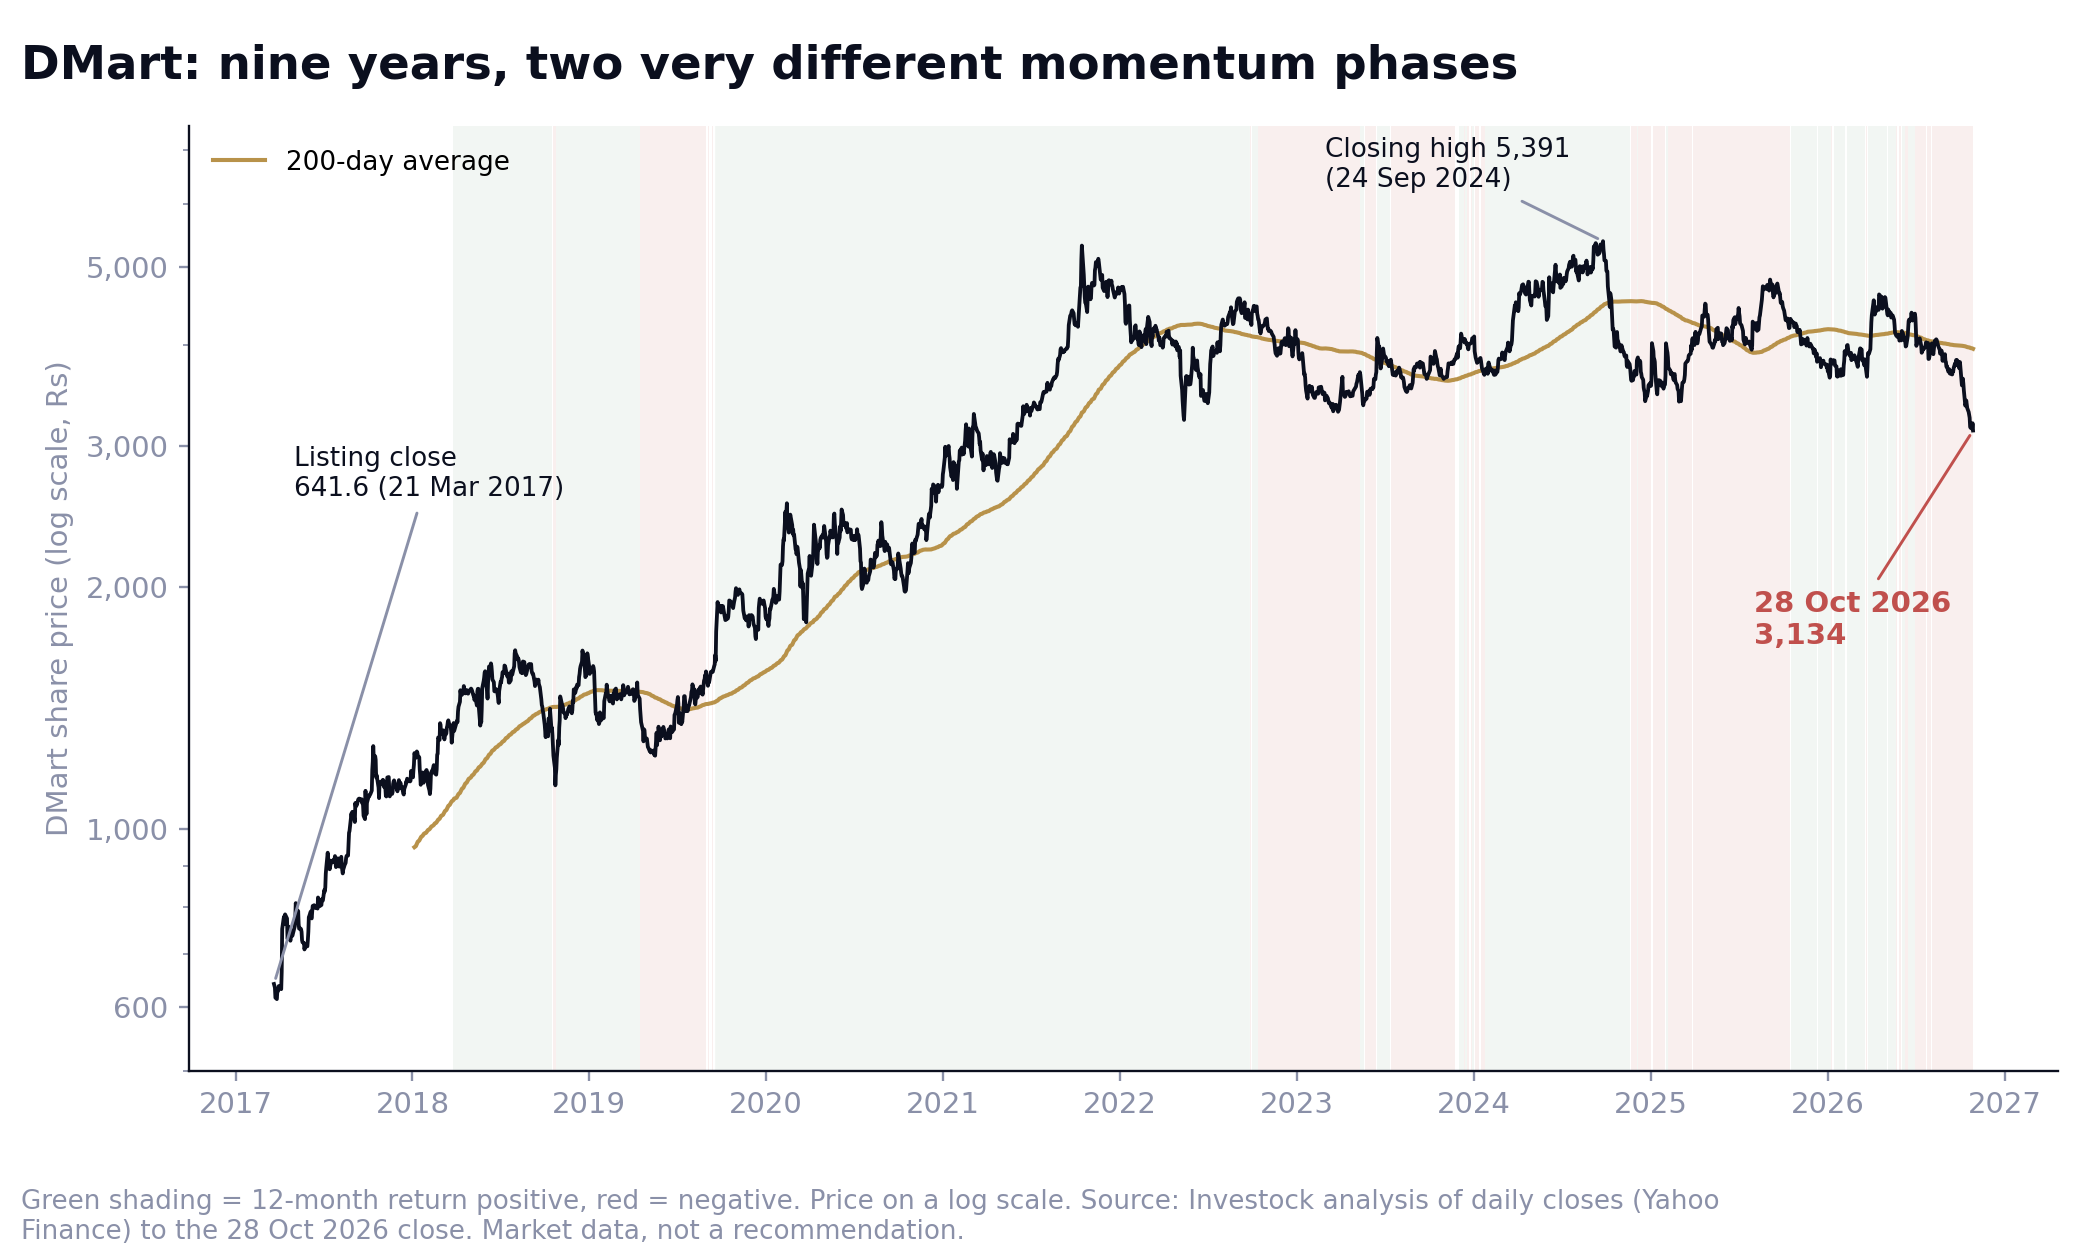
Two phases stand out. From listing to October 2021, DMart was a textbook momentum stock: it spent most of the time above its 200-day average and was up 170% in the 12 months to 14 October 2021. Then the price stopped compounding. For five years it has moved between roughly ₹3,100 and ₹5,400, with a failed breakout in 2024. Anyone who bought at the 18 October 2021 close is down 36% after five years, while the Nifty is up 23%. The long-term holder from the IPO is still well ahead, at about 10.5x the ₹299 issue price. Both statements are true.
What the momentum picture says today
| Measure | DMart on 28 Oct 2026 | How to read it |
|---|---|---|
| Price | ₹3,134 | Lowest close since 2 June 2021 |
| From closing high | -41.9% | Closing high ₹5,391 on 24 Sep 2024 |
| 12-month return | -25.8% | Nifty 50: -12.5% |
| 6-month return | -31.0% | Last seven weeks (-16%) have been the steepest leg |
| Versus 200-day average | -20.9% (₹3,961) | Below the average since mid-August; 50-day average ₹3,659 |
| Momentum rank (66 large caps) | 5th percentile | 98th in June 2020; 92nd on 18 Oct 2021; 17th on 9 Oct 2026 |
Source: Investock analysis of Yahoo Finance data. Rank = average of volatility-adjusted 6- and 12-month returns, ranked against 66 large caps that trade today. Market data, not a recommendation.
The business kept growing
This is not a story of a failing company. In the September quarter, standalone revenue was ₹19,206 crore (+18.4%), operating profit ₹1,403 crore (+14.1%, margin 7.3% against 7.6%) and profit after tax ₹804 crore (+7.6%). Same-store sales for stores older than two years grew 9.5%, against 6.8% a year earlier. DMart added 15 stores in the quarter, for a total of 518. Foreign investors trimmed their holding from 9.2% to 8.5% in the quarter while mutual funds raised theirs from 6.6% to 7.5%.
Why has the price fallen, then? Nobody can say for certain, and price moves reflect many buyers and sellers. The themes in analyst commentary are slower same-store growth earlier in the year (5.5% in the June quarter, against 10.8% in March), profit growing more slowly than revenue, competition from quick-commerce delivery apps, and a valuation reset. Depending on the source and date, DMart has traded at about 60x to 75x trailing earnings, which leaves little room for disappointment. The point is that the price began to respond to these concerns well before any annual accounts showed a problem, and momentum is simply a way of reading that response.
What momentum is, and what the research says
Academics have studied momentum for more than three decades. The classic paper is Jegadeesh and Titman (Journal of Finance, 1993), which found that buying US stocks that had been the best performers over the previous 3 to 12 months, and selling the worst, earned significant returns over the following 3 to 12 months, and that the result was not explained by standard measures of risk. Later work found the same pattern in many countries and asset classes (Asness, Moskowitz and Pedersen, 2013).
- In India,Agarwalla, Jacob and Varma of IIM Ahmedabad (working paper, 2013) built factor returns from Prowess data for roughly 1993 to 2013, excluding illiquid firms and correcting for survival bias. Their winners-minus-losers momentum factor averaged about 21.9% a year, against 15.3% for value and 11.5% for the market's excess return (figures indicative). Other Indian studies (Sehgal and Balakrishnan, 2002; Sehgal and Jain, 2011) also report that 6-to-12-month momentum earned returns that standard models did not explain.
- The index record,NSE publishes momentum indices. The Nifty200 Momentum 30 picks the 30 stocks of the Nifty 200 with the highest 'normalised momentum score', built from 6-month and 12-month price returns adjusted for each stock's volatility, weights them by free-float market capitalisation tilted by the score, and rebalances in June and December. The index was launched on 25 August 2020; its history back to April 2005 is back-calculated.
| Nifty200 Momentum 30, long run (total return) | Momentum 30 | Nifty 200 | Nifty 50 |
|---|---|---|---|
| Annual return since 1 Apr 2005 (to 30 Jun 2026) | 18.8% | 13.9% | 13.6% |
| 10 years | 17.8% | 13.5% | 12.5% |
| 5 years | 12.6% | 11.8% | 10.0% |
| 3 years | 14.1% | 12.1% | 8.8% |
| Financial years it beat the index (of 21, FY06 to FY26) | n/a | 14 of 21 | 15 of 21 |
Source: HDFC AMC presentation, July 2026 (most of the history is back-calculated). Returns are total returns.
Read together, the record is clear: over 21 years the momentum index has added about 5 points a year against the Nifty 50, and it has led the Nifty 50 over the last 3, 5 and 10 years. This year, to 30 September, it was down 5.2% against 13.4% for the Nifty 50 (NSE factsheet, price return). As of February 2026, India had 24 passive momentum funds with more than ₹17,000 crore in assets (NSE Indices data, as reported), a sign of how widely the idea has spread.
Momentum in real money: the ETF record
The cleanest real-world record of momentum in India is a momentum ETF. The Aditya Birla Sun Life Nifty 200 Momentum 30 ETF has traded since 19 August 2022. Here it is against Nippon India's Nifty 50 ETF:
| Period | Nifty 200 Momentum 30 ETF | Nifty 50 ETF |
|---|---|---|
| 19 Aug to 31 Dec 2022 | -7.0% | +2.3% |
| 2023 | +40.8% | +21.0% |
| 2024 | +22.3% | +10.4% |
| 2025 | -6.4% | +11.7% |
| 2026 to 28 Oct | -9.3% | -12.1% |
| Whole period | +36.0% | +34.1% |
Source: Investock analysis of ETF market prices (Yahoo Finance). ETF prices are not index returns and include fund costs. These are not Investock products.
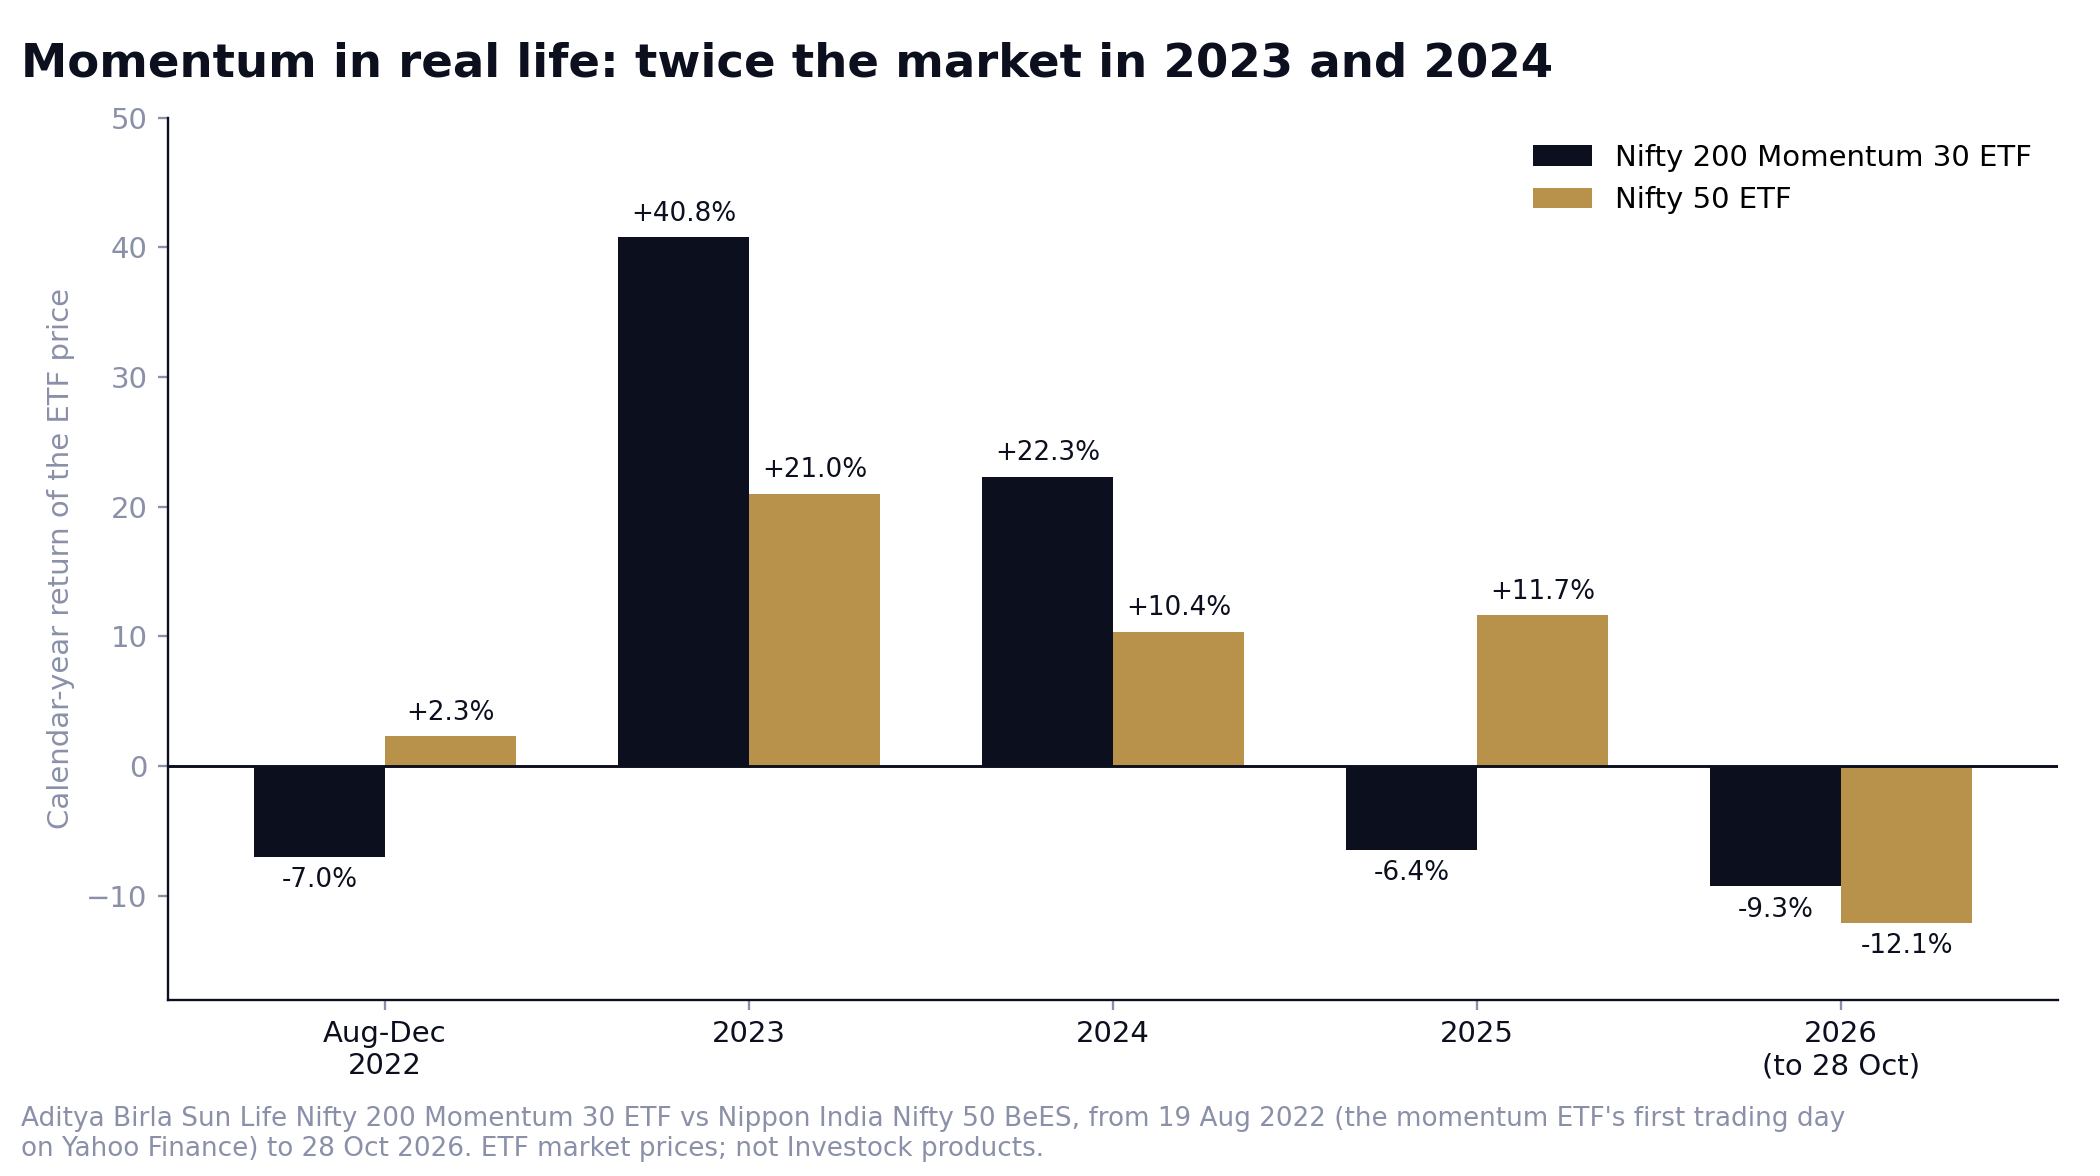
In 2023 the momentum ETF made nearly twice the market's return, a lead of almost 20 points in a single year. In 2024 it did it again, with a 12-point lead. That is what a momentum phase looks like: the strongest stocks keep getting stronger, and a portfolio built only from them pulls away from the index.
Momentum finds the big winners, and shows why the exit matters
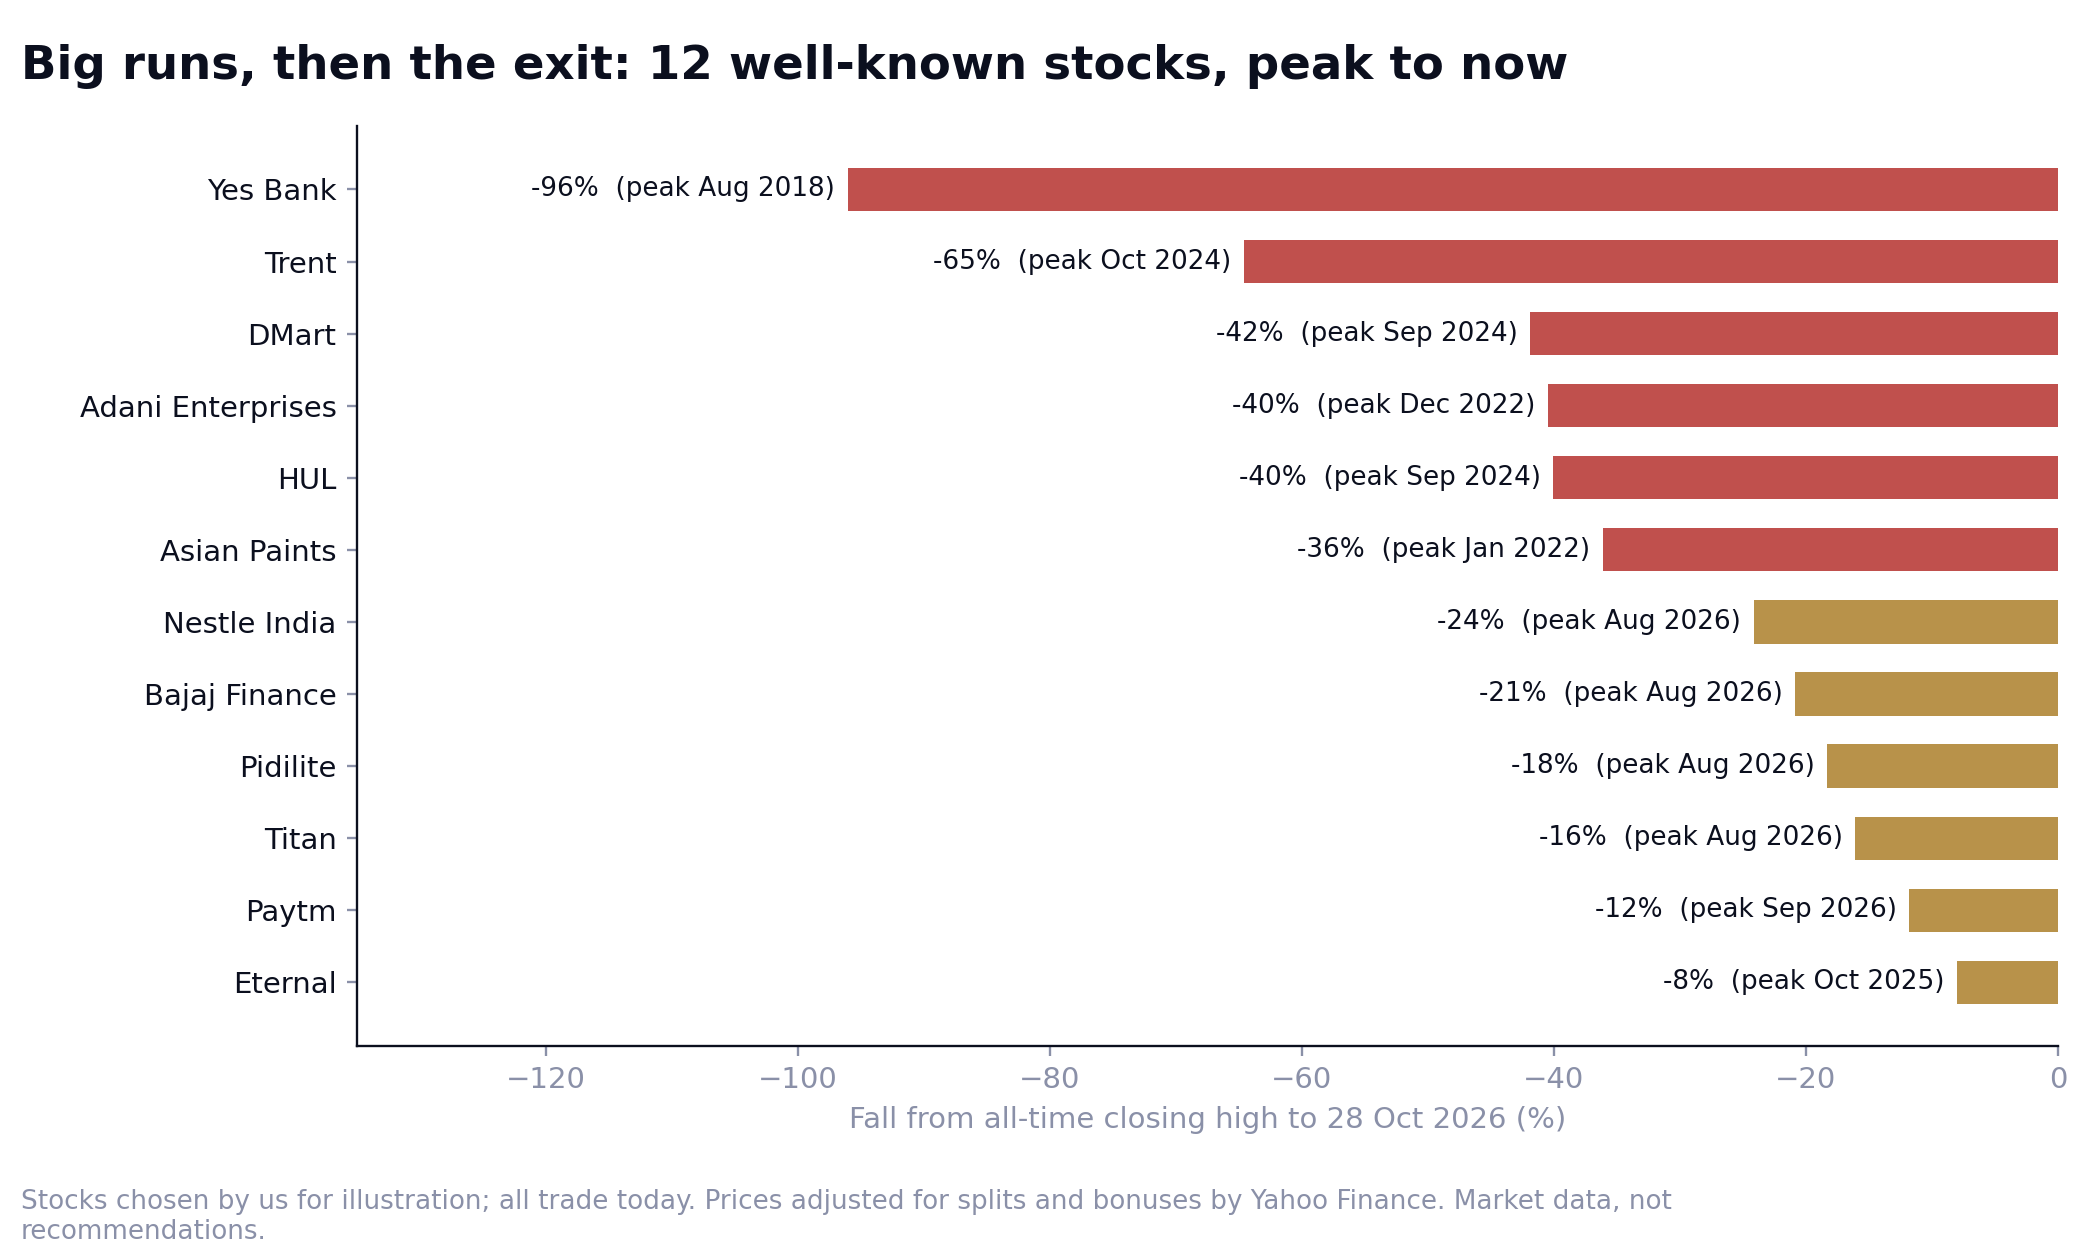
DMart is not alone. The chart shows twelve well-known stocks and how far each is from its all-time closing high today, and the table lists the seven with the biggest run-ups.
| Stock | Gain in the 3 years to its peak | Peak (closing) | Fall since |
|---|---|---|---|
| Adani Enterprises | +1,804% | Dec 2022 | -40% |
| Trent | +626% | Oct 2024 | -65% |
| Eternal (Zomato) | +472% | Oct 2025 | -8% |
| Yes Bank | +185% | Aug 2018 | -96% |
| Asian Paints | +155% | Jan 2022 | -36% |
| Paytm | +112% | Sep 2026 | -12% |
| DMart | +22% | Sep 2024 | -42% |
Source: Investock analysis of Yahoo Finance data to 28 Oct 2026, adjusted for splits and bonuses. A gain of 1,804% in three years reflects a very low starting price. Market data, not recommendations.
Two things stand out. First, the run-ups are what make momentum powerful: Trent rose more than sevenfold in the three years to October 2024, and Adani Enterprises rose about nineteen-fold in three years to its December 2022 peak. A strategy that owns stocks while they are running captures moves like these. Second, the peaks are where the decision gets hard. Yes Bank never recovered. DMart and Asian Paints went sideways and then lower. Eternal is only 8% below its high. Without a rule, every investor decides on the way down, and that is when decisions are hardest.
Why momentum exists
Researchers offer three explanations, and none is proven.
- Under-reaction,news is absorbed slowly, so prices keep moving in the same direction after good or bad results.
- Herding,investors chase what has worked, which extends trends.
- Slow money,large funds take weeks or months to build or reduce positions, which pushes prices gradually.
Momentum can also come from real changes the accounts have not yet shown, such as slower same-store sales or competition from new rivals.
The same logic explains the exit. Trends do not end on a schedule. DMart's rank was 98th in June 2020 and 92nd on its 2021 high, and no bell rang at the top. A momentum investor does not need to predict the turn. They need a rule that reacts to it.
What an investor can take from this
General education only. It is not a recommendation to buy, sell or hold anything.
- Momentum is information about the crowd, not about quality,DMart's price fell while its sales grew. A falling price does not mean a bad business, and a rising price does not mean a good one. It means the market's expectations changed.
- Decide the exit before the entry,The investor who bought DMart in 2021 and the investor who bought Yes Bank in 2018 both had to decide, in the middle of a fall, whether to sell. A rule written in advance, such as a fixed loss limit or a trailing stop, takes the feeling out of that moment.
- Let rules, not moods, decide,The strongest stocks in India's history ran for years. The investors who benefited were the ones who stayed with the trend and left by a plan.
- Spread the positions,If a leader can fall 42% to 65%, no single stock should be large enough to decide your result. Our post on position sizing shows how.
How momentum works in the Investock Model Portfolio
The Model Portfolio is built on exactly these lessons. In plain words:
- Momentum screening decides what to consider,We look for stocks showing price strength rather than guessing at turning points. The tier you choose (low, medium or high) reflects company size and speed.
- Equal weights,No single stock can dominate. A DMart-style fall in one position cannot sink the whole portfolio.
- One fixed day,New entries and rebalancing happen on Mondays only, so a scary headline on a Thursday cannot rush a decision.
- A predefined exit on every position,Each trade carries a stop-loss or trailing stop that is fixed before the entry. This is the half of momentum that the DMart chart shows to be hardest, and here the rule decides it, not the mood.
- A six-month tier lock,to stop switching style at the wrong moment.
You place the trades yourself in your own account. Investock provides the research and the process, and never handles your money. The Model Portfolio starts from ₹1,00,000. If you want momentum with the exit already decided, see how it works at investock.ai.
Related reading
- Fear and Greed Index at 11: why Indian stocks are falling
- Position sizing for small accounts: how much to put in one stock
- Market down 8 weeks in a row: what history says and what you can do
Frequently asked questions
What is momentum investing?
A style of investing that buys what has been rising and avoids or sells what has been falling, using price data rather than company accounts. A common measure is a stock's return over the past 6 to 12 months.
Does momentum investing work in India?
NSE's Nifty200 Momentum 30 index returned 18.8% a year against 13.6% for the Nifty 50 since 2005 (total return, partly back-calculated), and a Nifty 200 Momentum 30 ETF earned about twice the Nifty 50 ETF's return in both 2023 and 2024.
What is the DMart momentum example?
DMart rose about 10.5x from its issue price, but its price momentum turned after October 2021 and it now trades 42% below its closing high, even as its revenue grows 18%. It shows that price momentum and business growth can move in different directions for a long time. We take no view on the stock.
Why is the exit important in momentum investing?
Momentum stocks can run for years, but no one knows when the run ends. A stop-loss or trailing stop fixed in advance lets you stay with the trend and leave by a plan instead of by emotion.
Is momentum investing the same as buying what is hot?
No. Buying what is hot is a reaction. Momentum investing as a method has rules for what to buy, how much, and when to exit. Without the exit rules it is just chasing.
Does the Investock Model Portfolio use momentum?
Yes. It uses momentum screening to select stocks, equal weights, a fixed Monday entry day and a predefined exit rule on every trade. It is research from Investock; you place the trades in your own account.
Sources
- Prices, drawdowns, momentum ranks, ETF comparisons and all calculations: Investock analysis of daily Yahoo Finance data to the 28 October 2026 close: DMart, 66 large caps, Nifty 50, and ETFs (Aditya Birla Sun Life Nifty 200 Momentum 30, Nippon India Nifty 50 BeES). Prices adjusted for splits and bonuses.
- DMart IPO, listing and results: Business Standard and PTI (March 2017, via search); GoodReturns (10 and 12 Oct 2026); Kotak Neo (28 Oct, 26 Aug 2026); Business Today (13 Jul 2026); Trendlyne shareholding pattern (Sep 2026).
- NSE momentum indices: NSE Indices factsheets dated 30 September 2026 (methodology and returns); HDFC AMC presentation, July 2026 (long-run total returns and financial-year table).
- Academic research: Jegadeesh and Titman, Journal of Finance (1993), abstract; Asness, Moskowitz and Pedersen, Journal of Finance (2013); Agarwalla, Jacob and Varma, IIM Ahmedabad working paper 2013-09-05; Sehgal and Balakrishnan (2002); Sehgal and Jain (2011).
- Passive momentum funds: NSE Indices data via Dealplexus (February 2026).
- Earlier Investock posts: 'Market Down 8 Weeks in a Row' (3 October), 'Position Sizing for Small Accounts' (9 October), 'Fear and Greed Index at 11' (26 October).