Fear and Greed Index at 11: Why Indian Stocks Are Falling and What 17 Past Fear Signals Show
The fear and greed index is at 11. Why the Nifty is down 14%, what followed 17 past fear signals since 2008, and how long past falls lasted.
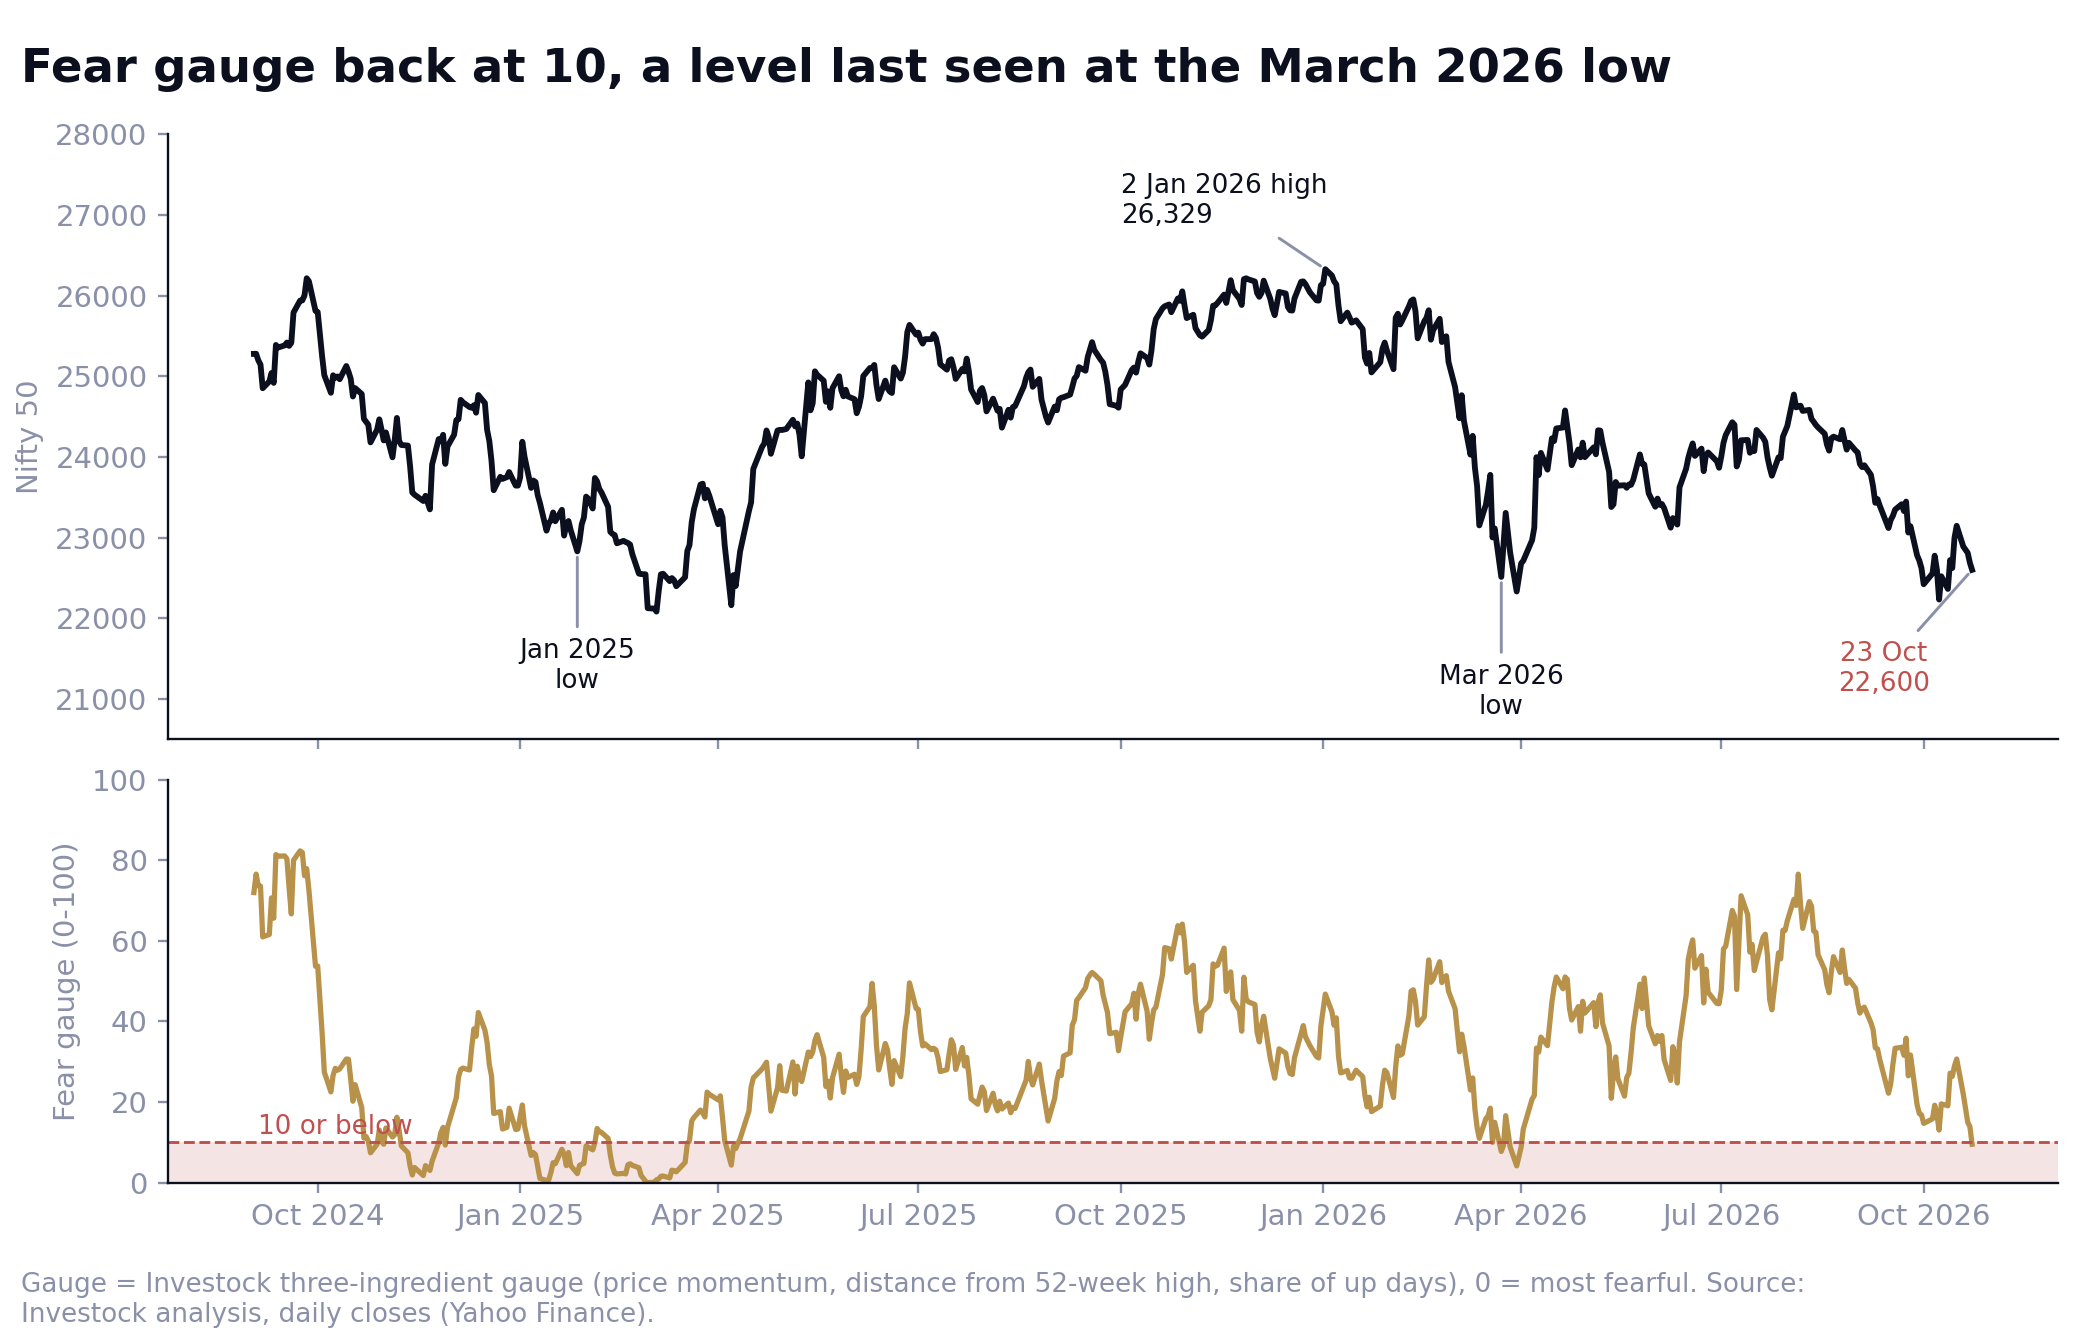
India's fear and greed index has dropped to 11, according to a chart now doing the rounds. That is below the March 2026 low of 13 and above only the January 2025 low of 7. The Nifty 50 closed at 22,600 on 23 October, 14.2% below its closing high of 26,328.55 on 2 January, after four straight daily falls. In that week mid-caps fell about 5.2% and small-caps about 7.2%, and only 16% of Nifty 50 stocks were trading above their 50-day average.
If you have checked your portfolio this week, the questions are fair. Why is this happening? When did it last happen, and what followed? How long can it last? And is there anything an investor can actually do with a reading like this? We went back through Nifty data since 2007, built a fear gauge of our own so we could test the history, and lined up every fall of 10% or more since 2007. The answers are more careful than a headline.
Written on 26 October 2026. Market data is to the 23 October close unless stated. The fear and greed reading of 11 comes from a chart whose publisher we could not identify; our own gauge, built from public data, is used for all the history. Educational content, not investment advice or a market forecast.
- The reading: the chart's index is at 11 (lows: 7 in January 2025, 13 in March 2026). Our own gauge, built from price data, read 9.5 on 23 October. The Nifty is 14.2% below its 2 January high, down 13.5% this year, and about 1.2% above its March 2026 low.
- Why: foreign investors sold about ₹51,000 crore in October (to 25 October), Brent settled near $116 to $117 on 23 October, US 10-year yields are around 5.1% to 5.3%, the RBI raised rates on 7 October, Infosys cut its FY27 guidance, and breadth is thin. The India VIX, at 16.9, is not showing panic.
- History of fear signals: since October 2008 our gauge has fallen to 10 or below 17 times. The Nifty then fell a median 8.6% further (7 of 17 times by more than 10%). The low came a median 47 days later, but it came within 30 days in 8 cases and took over 100 days in 8 others.
- A year later: the Nifty was higher in 13 of 16 cases (81%), median +10.2%. That is no better than a random day since 2008 (+10.7%, 81%). The worst case was -12.5%.
- How long: the nine earlier 10%-plus falls took a median 159 days from peak to low and another 231 days to regain the old high (402 in total). Today's fall is 294 days old, and 279 days to its low so far.
- What an investor can do: spreading a purchase over three monthly instalments beat buying all at once in only 5 of 16 past signals. History does not reward a trade on the reading. It rewards being sized so you are not forced to sell.
- What this post is not: a call to buy, sell or wait, or a forecast of the low.
Where the market stands
| Measure | Level (23 Oct close unless stated) | Context |
|---|---|---|
| Nifty 50 | 22,600 | -14.2% from the 2 Jan closing high (26,328.55); -13.5% in 2026; -12.7% in a year; lowest close 22,231.80 on 8 Oct (-15.6%) |
| Sensex | 73,123.83 | -14.2% in 2026 |
| Bank Nifty | 54,287 | -6.5% in a year |
| Mid-caps and small-caps | Week to 23 Oct: Nifty Midcap 150 -5.2%, Smallcap 250 -7.2% | Nifty 50 -2.3% and Bank Nifty -2.7% that week; only IT held (+0.2%) |
| Breadth | 16% of Nifty 50 stocks above their 50-day average | About 29% earlier in October; about 7% at the April low (Upstox) |
| India VIX | 16.86 | Up about 20% on the week; 14.5 on 1 Oct; 83.6 at the March 2020 peak |
| Brent crude | About $116.7 (settlement) | About $108 on 16 Oct; eased on 26 Oct |
| USD/INR | About 94.9 | Not a record: the weakest close was about 96.9 in May |
| US 10-year yield | About 5.1% to 5.3% (sources differ) | Described in press reports as the highest since 2007 |
| Foreign investors (FPI) | About -₹51,000 crore in October to 25 Oct; -₹44,000 crore in September | About -₹3.0 to 3.1 lakh crore in 2026 (net of primary-market inflows) |
| Domestic institutions (DII) | About +₹59,000 crore in October to 25 Oct | The cushion that has stopped a faster fall |
Sources: Investock analysis of daily closes (Yahoo Finance); Upstox (25 Oct), Kotak Neo, Paterson Capital, Angel One and press reports for weekly moves, breadth and flows. Flow figures differ by source and basis (NSDL, CDSL, exchange); see the fact-check sheet.
Why are stocks falling? Six pressures at once
There is no single trigger. Our 1 October post called this a slow grind, and a grind has many small causes. Here are the six that analysts and the data point to, each with the numbers.
| Pressure | What the numbers say |
|---|---|
| 1. Foreign selling | FPIs sold about ₹51,000 crore in October (to 25 Oct) after about ₹44,000 crore in September. Their 15-session selling streak ended on 16 October with ₹1,166 crore of buying, and it did not last. Domestic institutions bought about ₹59,000 crore in October, which has slowed the fall without stopping it. Analysts cite US yields, a strong dollar, an AI-led rally in other Asian markets, Indian valuations, a weak rupee and crude. |
| 2. Crude oil | Brent settled near $116 to $117 on 23 October, up about 6% on the week, after $108 on 16 October. Our crude post covered the channels: India imports 88.7% of its oil, and each $10 adds about 0.35 points to the current account deficit in ICRA's scenarios. Brent eased on 26 October. |
| 3. US yields and the Fed | The US 10-year yield is around 5.1% to 5.3% depending on the source. US consumer inflation for September was 3.7%, against 3.6% expected. The Fed decides on 28 October; a hold is widely expected, and some commentators expect another hike in December. Higher US yields pull money from emerging markets. |
| 4. Rate and rupee pressure at home | The RBI raised the repo rate by 25 basis points to 5.50% on 7 October, its first hike since February 2023, and the Governor said a cut is off the table near term. The rupee closed near 94.9 on 23 October. Foreign exchange reserves were about $726 billion on 9 October, against a record $785.7 billion on 4 September. |
| 5. Earnings | Infosys cut its FY27 constant-currency revenue growth guidance to 1% to 2% (from 1.5% to 3%) on 23 October, though it kept its 20% to 22% margin guide. HDFC Bank's net interest margin fell to 3.16% and ICICI Bank's to 4.18% (from 4.36%) in the September quarter. Axis Bank fell about 4% on 19 October after profit missed estimates. |
| 6. Global risk appetite | US stocks sold off in mid-October after a hot inflation print and an AI-trade wobble: the Nasdaq fell about 2.1% on 16 October and about 4.5% on the week, its worst since June (press reports). Korea's KOSPI fell 7.6% on 15 October, as we covered. India has moved with that mood. |
Sources: NSDL, Upstox, Angel One, Choice Wealth, Kotak Neo, Paterson Capital, SEC filing (Infosys 6-K), RBI, company results and press reports as listed in the fact-check sheet. Several figures come from secondary sources and differ across outlets.
Two things are not on this list. First, the Jio Platforms IPO, which raised ₹30,213 crore and lists on 28 October: we found no analyst blaming it for the fall. Second, panic. The India VIX is at about 17, not the 25 to 30 range of earlier stress, and domestic investors have been buyers all month. What is happening looks less like a crash and more like a market where very few things are working at once.
That is also what the fear reading picks up. Breadth, the share of stocks rising, is the weakest ingredient. With only 16% of Nifty 50 stocks above their 50-day average, the index understates how widely stocks have been marked down, which is why mid-caps and small-caps fell two to three times as much as the Nifty this week.
What the fear and greed reading measures
A fear and greed index squeezes several market signals into one number from 0 to 100. Low readings mean investors are behaving fearfully: prices falling, few stocks rising, protection costing more, money moving to safer assets. High readings mean the opposite. The chart that prompted this post puts today's reading at 11, below its 'extreme fear' line of about 25. Its own labels show the previous lows: 7 in January 2025 and 13 in March 2026.
The chart's source line says it is built from NSE total-return indices (Nifty 500, Nifty 100, Smallcap 250 and a 5-year government bond index) plus the breadth of the liquid universe from NSE's daily bhavcopy. That is a sensible mix: it compares shares with bonds, small companies with large ones, and counts how many stocks are actually rising. We cannot see the exact formula, so for the history below we built a simpler gauge of our own from three public ingredients.
Our gauge, in plain words
- Price momentum,the Nifty 500 against its own 125-day average.
- Strength,how far the Nifty 500 is below its 52-week high.
- Persistence,the share of the last 20 sessions that closed higher.
- Each ingredient is ranked against the previous two years of its own history (0 = weakest ever seen in that window), then averaged. The rank uses only past data, so there is no hindsight in it.
Our gauge is not the chart's index and will not match it day by day. But it lines up with the lows the chart labels: it fell to the single digits in January 2025, to about 4 to 8 in late March 2026, and read 9.5 on 23 October 2026. In this fall it first dropped to 15 on 1 October, bounced to 31 on 16 October when the Nifty reached 23,146, and then slid to the low reading on 23 October.
When did this last happen? Every fear signal since 2008
We defined a signal as the first day our gauge fell to 10 or below after at least 60 days above that level. That gives 17 signals since October 2008, plus the current one. The table shows what the Nifty did next: how much further it fell before its low within a year, how many days that low took to arrive, and the return one, three, six and twelve months later.
| Signal date | Nifty | Further fall | Days to low | 1M | 3M | 6M | 12M |
|---|---|---|---|---|---|---|---|
| 20 Oct 2008 | 3,123 | -19.2% | 7 | -13.7% | -8.8% | +15.9% | +56.3% |
| 21 Jan 2009 | 2,706 | -4.9% | 47 | +1.1% | +35.0% | +68.9% | +74.4% |
| 27 Jan 2011 | 5,604 | -18.9% | 327 | -5.4% | +1.7% | -1.6% | -4.0% |
| 3 May 2011 | 5,565 | -18.3% | 231 | -0.3% | -2.0% | -5.0% | -12.5% |
| 21 Aug 2013 | 5,303 | -0.3% | 7 | +13.4% | +15.3% | +16.9% | +53.0% |
| 12 May 2015 | 8,127 | -14.2% | 289 | 0.0% | +5.4% | -4.2% | -4.6% |
| 31 Aug 2015 | 7,971 | -12.6% | 178 | -0.3% | -2.6% | -5.5% | +9.7% |
| 26 Dec 2016 | 7,908 | 0.0% | 0 | +7.2% | +15.1% | +20.2% | +33.2% |
| 6 Mar 2018 | 10,249 | -2.5% | 17 | +0.8% | +4.2% | +12.0% | +10.7% |
| 27 Sep 2018 | 10,978 | -8.6% | 29 | -7.1% | -1.7% | +6.3% | +4.1% |
| 29 Jan 2019 | 10,652 | -0.4% | 21 | +1.3% | +6.6% | +2.8% | +14.5% |
| 1 Aug 2019 | 10,980 | -30.7% | 235 | -1.2% | +8.5% | +10.2% | +2.9% |
| 6 Mar 2020 | 10,989 | -30.7% | 17 | -17.1% | -9.3% | +2.6% | +36.8% |
| 7 Mar 2022 | 15,863 | -3.6% | 102 | +12.3% | +3.1% | +12.2% | +9.8% |
| 27 Feb 2023 | 17,393 | -2.6% | 25 | -1.8% | +6.6% | +11.7% | +29.3% |
| 25 Oct 2024 | 24,181 | -8.7% | 130 | +0.4% | -5.6% | +0.7% | +6.4% |
| 23 Mar 2026 | 22,513 | -1.2% | 199 | +7.0% | +6.4% | +2.8% | not yet |
| 23 Oct 2026 | 22,600 | ? | ? | ? | ? | ? | ? |
Source: Investock analysis of Nifty 50 daily closes (Yahoo Finance), price index, excluding dividends. 'Further fall' is the deepest close within 252 trading days of the signal, against the signal-day close. 2008 and 2020 returns are dominated by the global crises of those years.
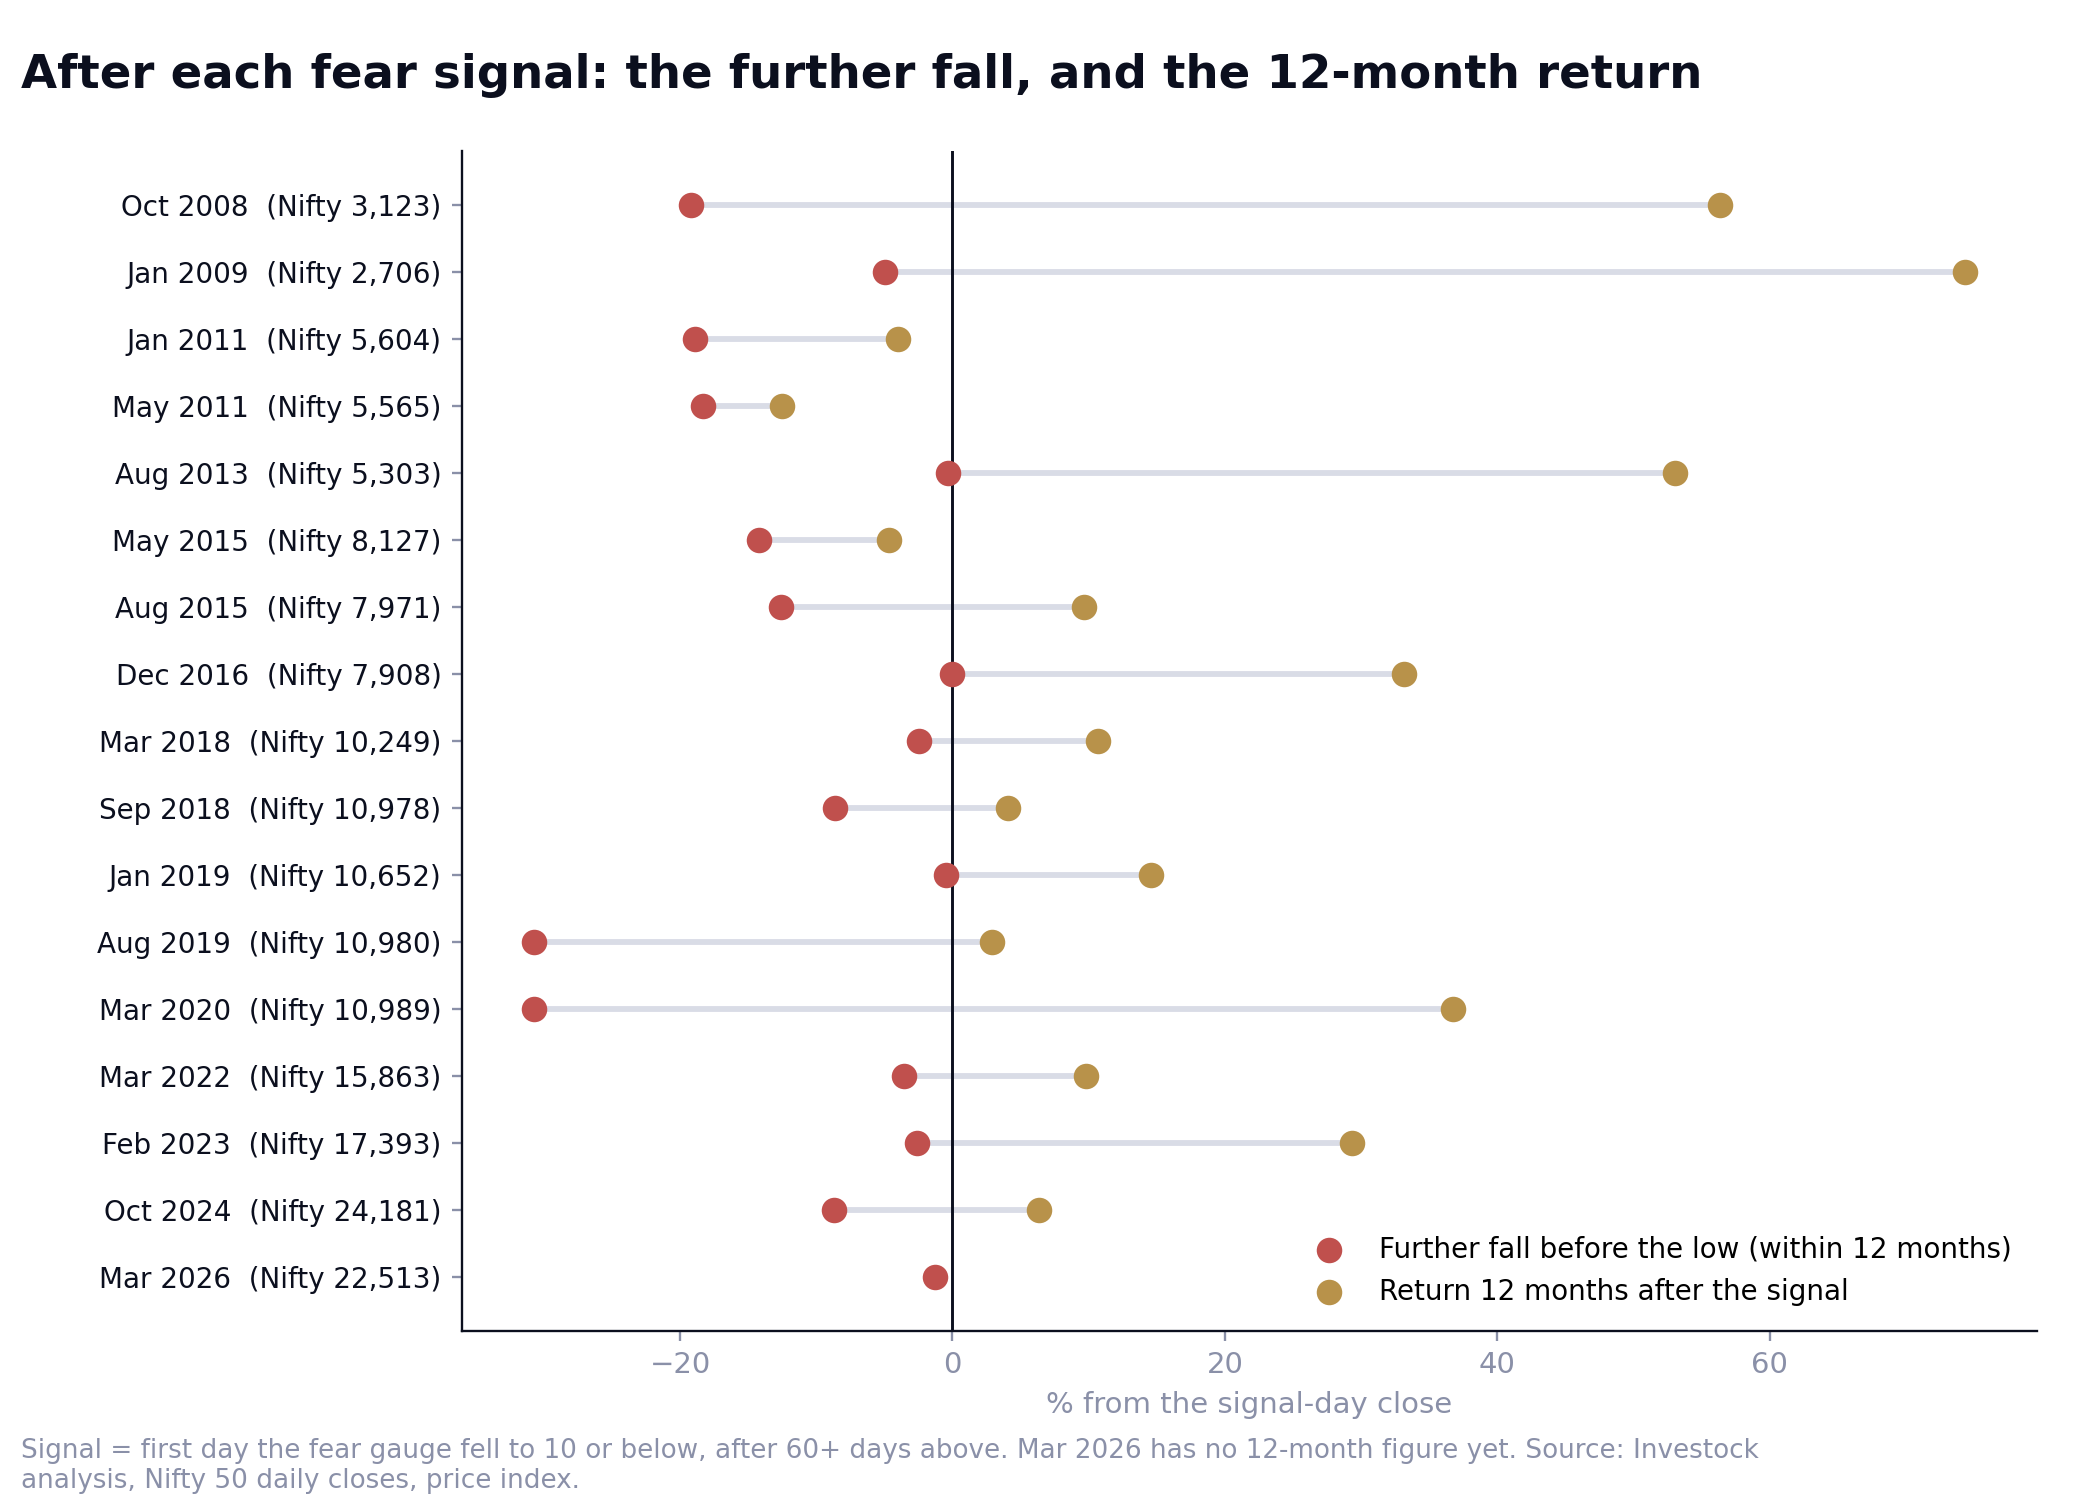
Four patterns stand out.
- The fall rarely ended on the signal day,The median further fall was 8.6%. In 7 of 17 cases the Nifty fell more than 10% further (2008, 2011 twice, 2015 twice, and 2019 and 2020 at about 31%). In 6 of 17 it fell less than 3%.
- The low came either quickly or slowly,In 8 of 17 cases the low arrived within 30 days. In another 8 it took more than 100 days, and the longest was 327 days (January 2011). The median is 47 days, but the median describes almost none of the actual cases.
- A year later the Nifty was usually higher, but not always,It was higher in 13 of 16 cases with a full year of data (81%), with a median of +10.2%. The three failures (January 2011, May 2011 and May 2015) all came when the market kept falling for more than 10%. The worst 12-month result was -12.5%.
- It was not an edge,Over any 12 months since October 2008, the Nifty's median return was +10.7% and it was higher 81% of the time. After a fear signal the figures are +10.2% and 81%. The signal tells you the mood is bad. It does not tell you the future is better than usual.
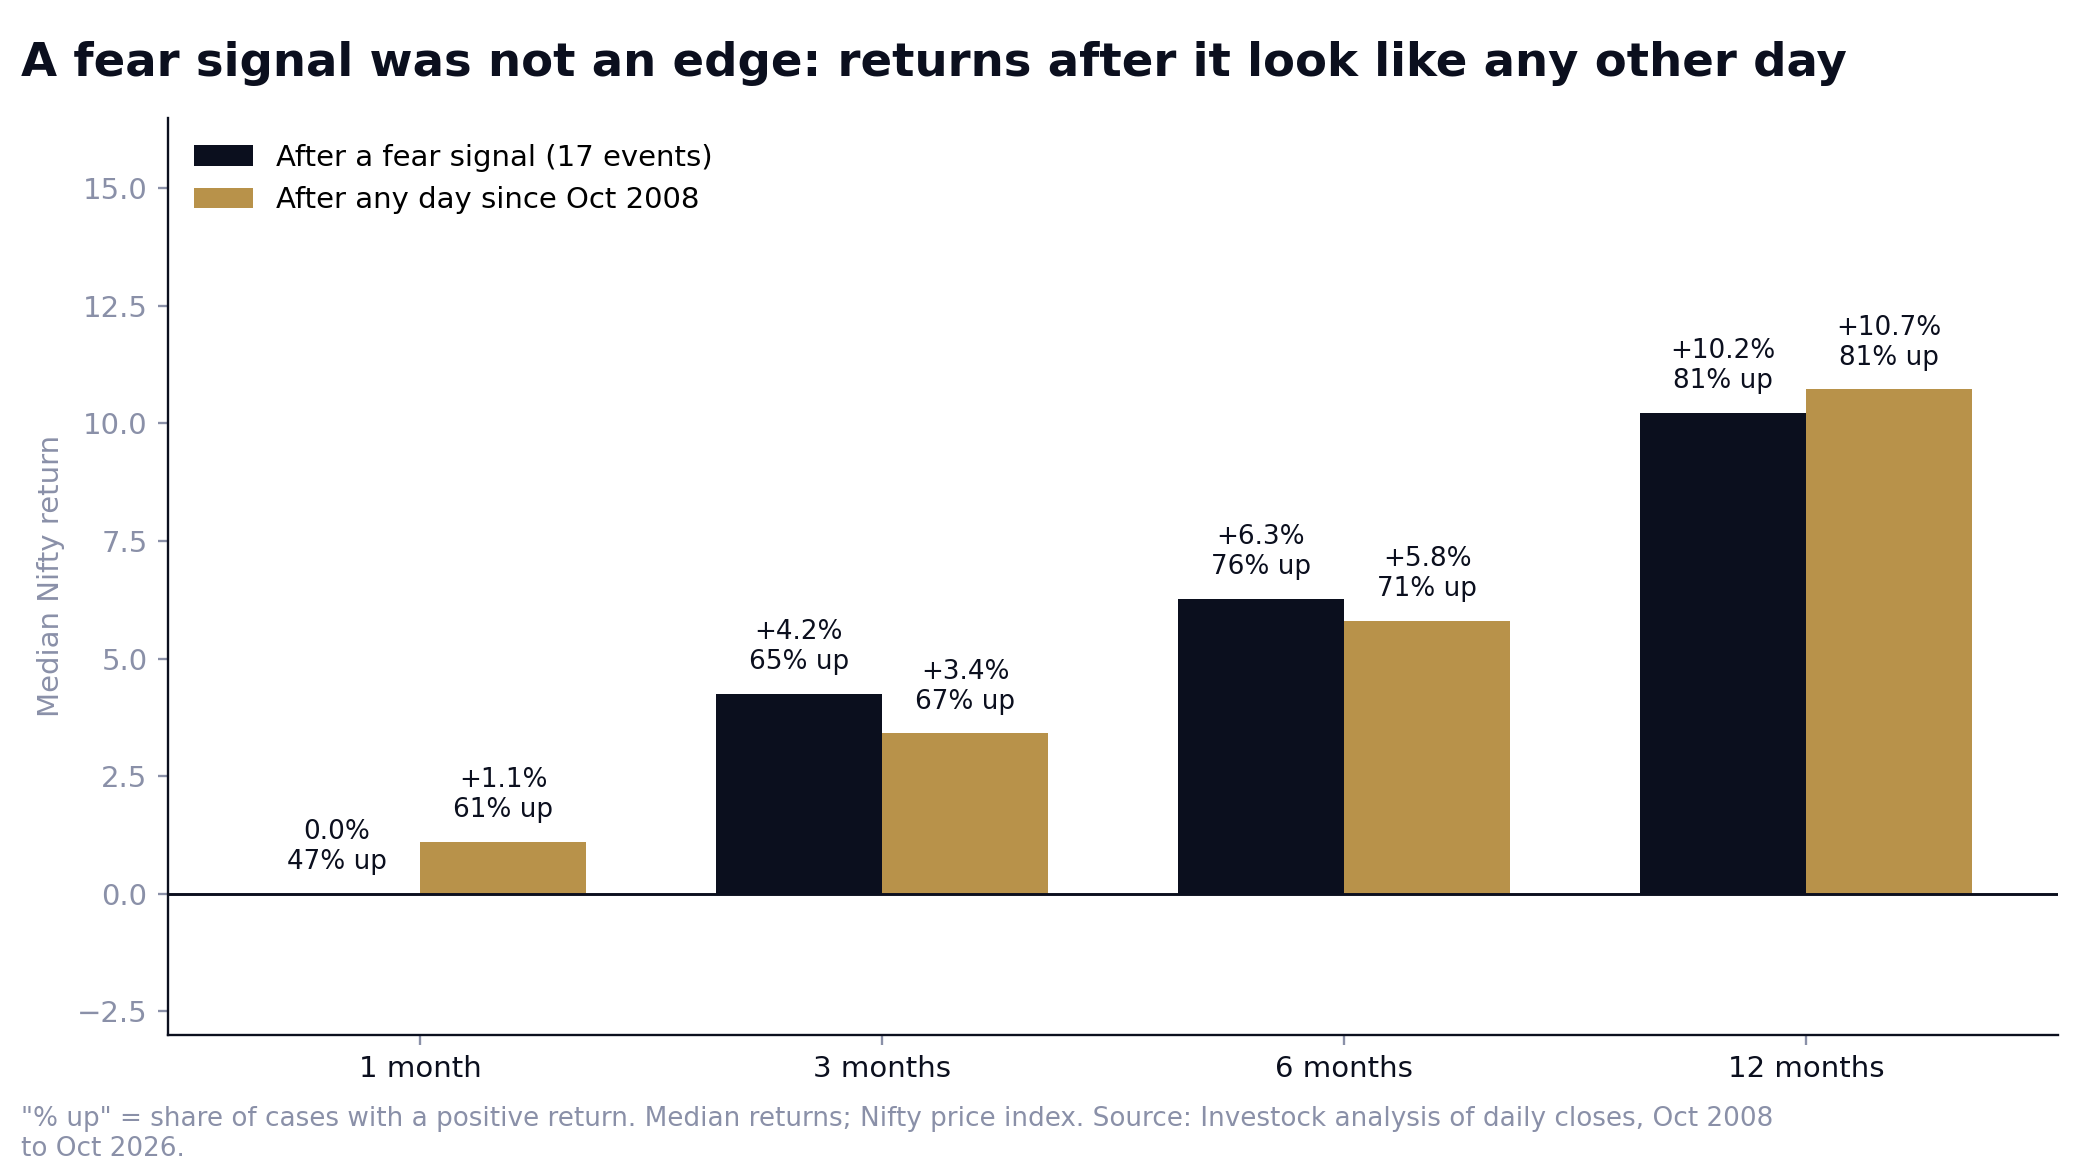
Why this differs from our 1 October post. That post looked at weekly losing streaks, where the Sensex was higher a month later in most cases. A streak counts weeks. A fear signal counts depth, strength and persistence. They flag different days, and after our fear signals the Nifty was higher one month later only 47% of the time. One signal never settles the question.
The two lows on the chart
The chart labels two earlier lows. After the January 2025 low (a Nifty close of 22,829 on 27 January 2025), the index slipped another 3.3% to 22,083 on 4 March, then was up 12.7% a year later. After the March 2026 low (22,331 on 30 March 2026), it rose 8.0% in a month and 10.9% by 3 August (24,774). It then gave all of that back. On 26 October the Nifty is only about 1.3% above that March low, so the past seven months have been a round trip.
How we ran this, and what it cannot tell you
- The gauge is ours, built from price data only. It is correlated with the chart's index but is not the same index, and it has no bond-market ingredient.
- Seventeen signals is a small sample and the signals overlap in time (2011, 2015 and 2019 each have two). Treat the medians as description, not as statistics you can bank.
- Returns are price returns on the Nifty 50, without dividends, costs or taxes, and measured from the signal-day close. They are not returns of any Investock product or recommendation.
- We tested variants: a threshold of 15 instead of 10, and a four-ingredient version that adds the India VIX. Median further falls ranged from 6% to 10% and median 12-month returns from +6% to +14%, so the picture does not depend on the exact cut. We did change the design once: an early version with a large-versus-broad-market ingredient failed to flag the March 2020 crash, so we dropped it.
Fear in prices, not in options
One feature of this fall is unusual. Our fear gauge is at 10, but the India VIX, the market's own measure of expected volatility, is about 17 (16.9 at the 23 October close). On the 17 earlier signal days, the VIX had a median of 21.6. It was above 30 only in October 2008 (57) and January 2009 (45). In March 2020 it was 25.6 on the signal day and later hit 83.6.
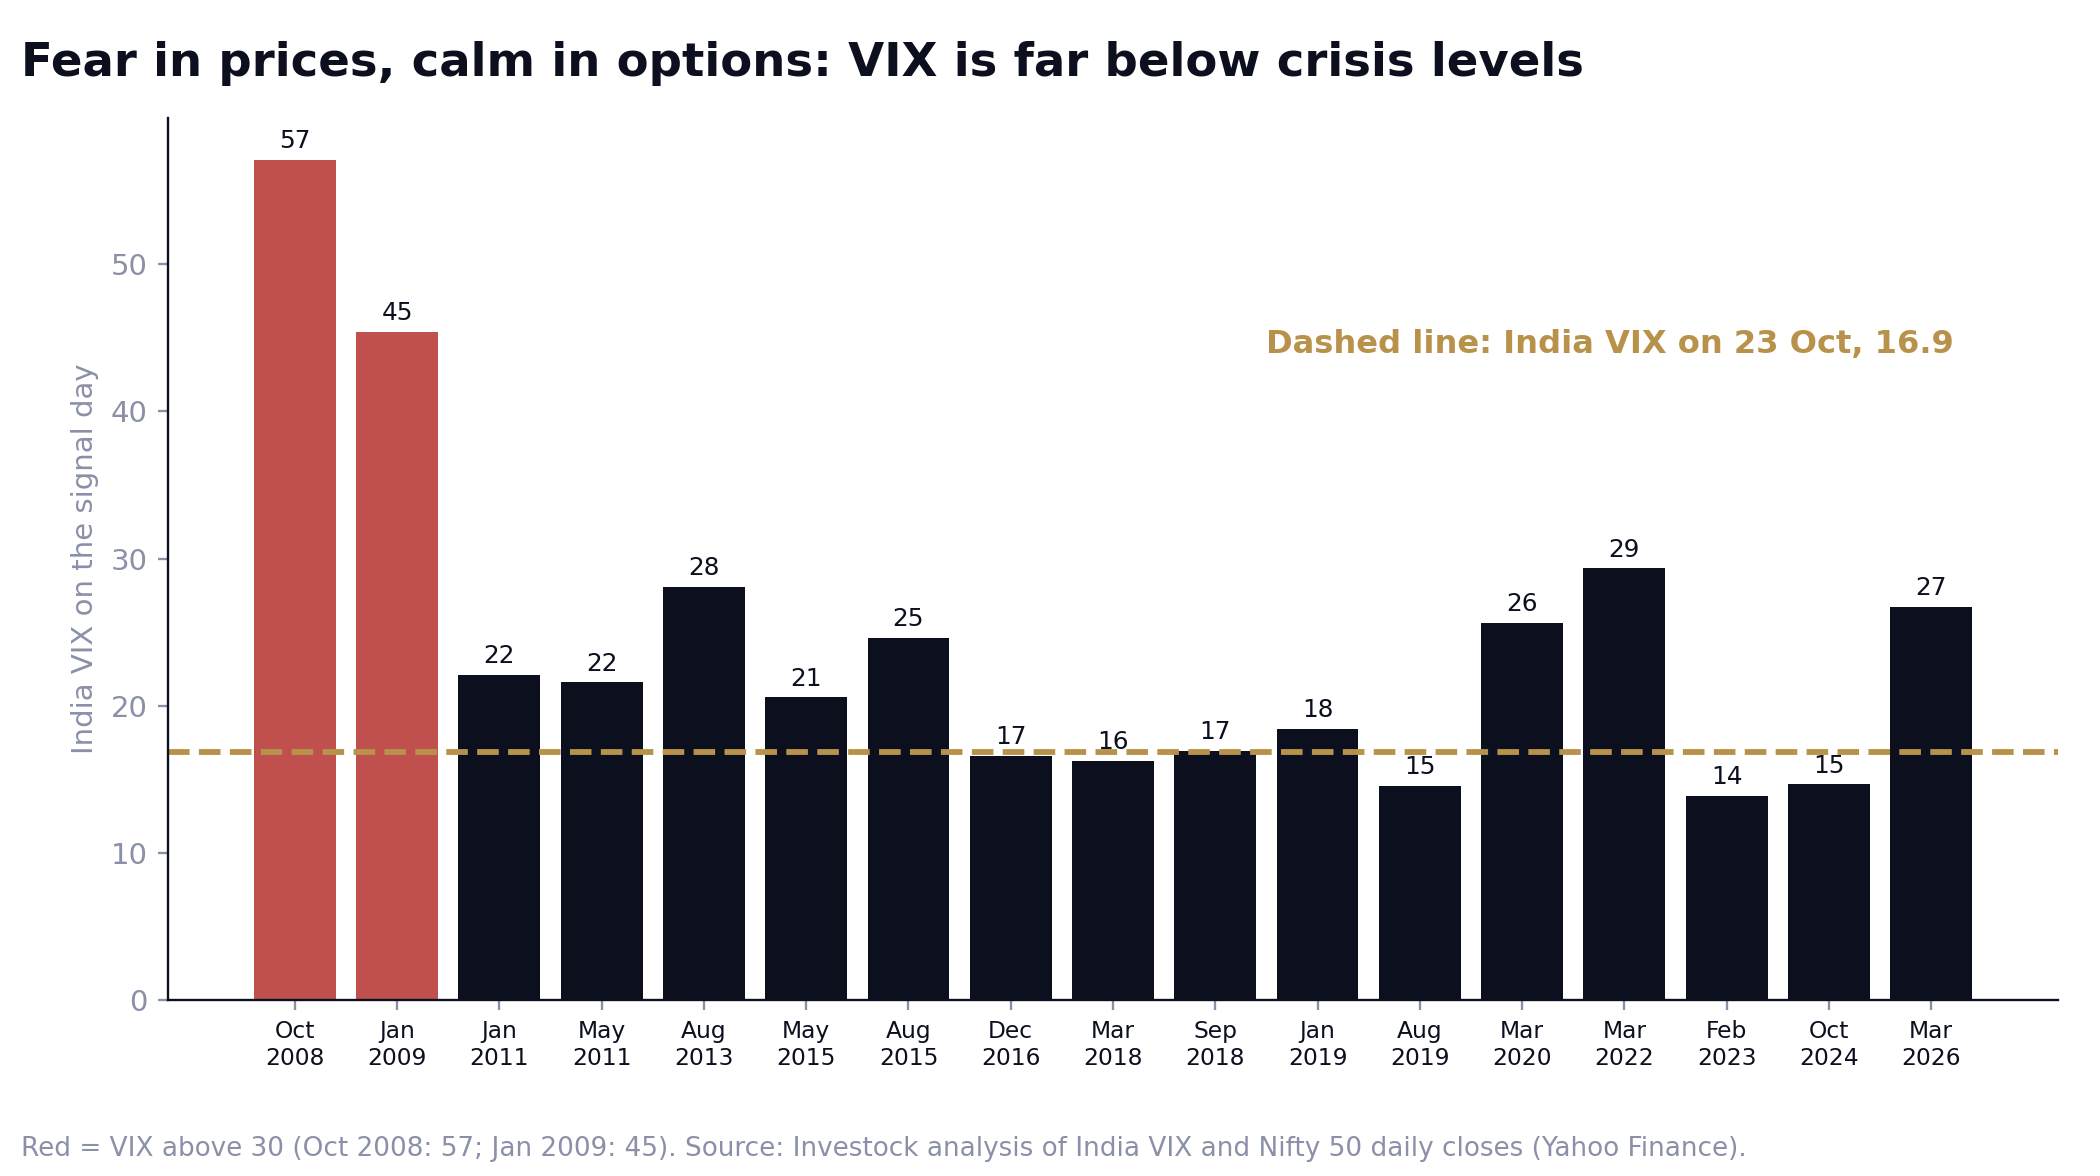
That fits the shape of this decline. Our 1 October post noted that the fall was a slow grind of about 1.1% a week, not a crash, and the VIX was 14.5 then. Slow grinds wear down breadth and momentum, which is what these gauges measure, without producing the panic days that push the VIX up. The risk of a grind is that nothing marks the end of it. The risk of a spike is that it can reverse in days. History offers both.
How long can the pain last? Every 10% fall since 2007
Nobody can say how long a fall will last. What we can do is measure how long the earlier ones did. Since 2007 the Nifty has had nine falls of 10% or more that were later fully recovered, plus the current one.
| Peak | Low | Fall | Peak to low (days) | Low to old high (days) | Total (days) |
|---|---|---|---|---|---|
| Jan 2008 | Oct 2008 | -59.9% | 293 | 743 | 1,036 |
| Nov 2010 | Dec 2011 | -27.9% | 406 | 682 | 1,088 |
| Mar 2015 | Feb 2016 | -22.5% | 359 | 383 | 742 |
| Jan 2018 | Mar 2018 | -10.2% | 53 | 123 | 176 |
| Aug 2018 | Oct 2018 | -14.6% | 59 | 172 | 231 |
| Jun 2019 | Sep 2019 | -11.4% | 108 | 69 | 177 |
| Jan 2020 | Mar 2020 | -38.4% | 69 | 231 | 300 |
| Oct 2021 | Jun 2022 | -17.2% | 242 | 160 | 402 |
| Sep 2024 | Mar 2025 | -15.8% | 159 | 304 | 463 |
| Median of nine | -17.2% | 159 | 231 | 402 | |
| Jan 2026 to now | Low 8 Oct | -15.6% (now -14.2%) | 279 to the low so far | ? | 294 and counting |
Source: Investock analysis of Nifty 50 daily closes, price index. Days are calendar days. Our 1 October post used weekly closes and a 15% cut-off, so its figures differ slightly. A low is only visible in hindsight.
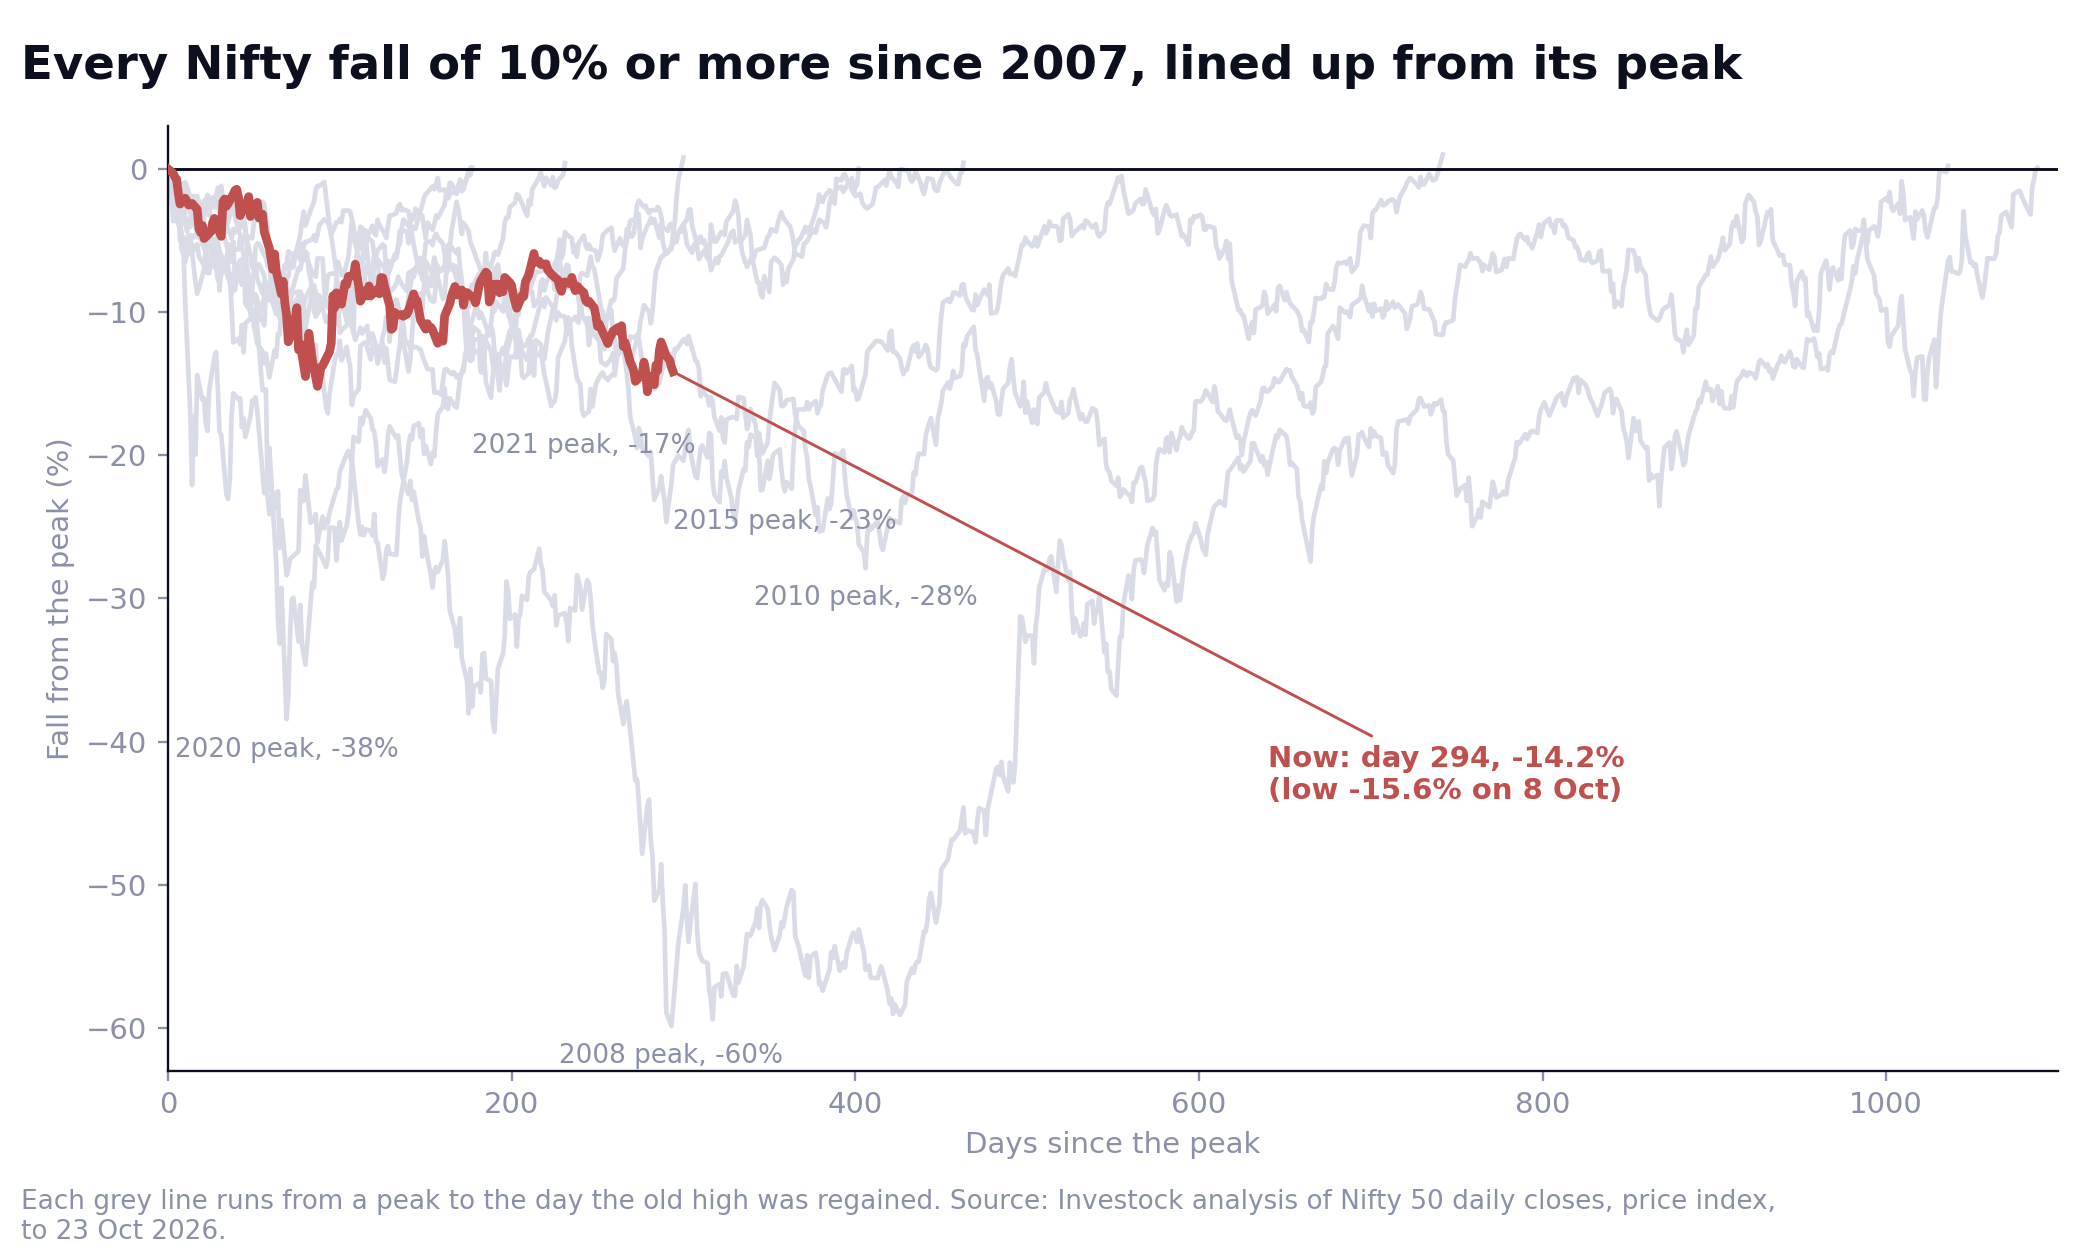
Where does today's fall sit among them?
- Depth,at -15.6% on its worst close (8 October), it is deeper than three of the nine earlier falls (-10.2%, -11.4%, -14.6%) and shallower than the other six, including the last two (-17.2% and -15.8%, the second one narrowly).
- Time,279 days from the peak to the low so far, longer than six of the nine (only 2008, 2010 and 2015 took longer to bottom). Every earlier fall that took this long to bottom ended at least 17% down, so time and depth have gone together in the past.
- After the low,the median wait to regain the old high was 231 days, from 69 days (2019) to 743 days (2008). Add that to the peak-to-low time and the median total was 402 days, from 176 to 1,088.
- The mood normalised faster than the price,After our 17 signals, the gauge climbed back above 30 within a median 38 days (range 7 to 63). That measures how quickly sentiment recovered, which it can do while prices are still below their old highs.
There are two honest readings. If this is like 2018 to 2019, 2021 to 2022 or 2024 to 2025, the low is probably near and the old high is a year or so away. If it is like 2008, 2010 or 2015, there may be further to fall and the recovery takes years. Nothing in the price history can tell these apart in advance, and this post does not try to.
What can an investor do with a fear reading?
This section is education only. It is not a recommendation to buy, sell or hold anything, and it does not consider your situation.
The numbers above rule out the most popular idea, that extreme fear is a reliable signal to buy. After our 17 signals the Nifty's returns looked like those after any other day, and in 7 of the 17 cases it fell more than 10% further. They also rule out the opposite idea, that nothing can be done. Here is what the history does support.
1. Spreading entries changed the worst case a little and the median not at all
We tested a simple rule on the 16 signals with a full year of data: put the same total sum in all at once on the signal day, or in three or six equal monthly instalments (every 21 trading days).
| Entry method | Median 12-month result | Worst case | Best case | Beat buying all at once |
|---|---|---|---|---|
| All at once | +10.2% | -12.5% | +74.4% | n/a |
| 3 monthly instalments | +9.1% | -12.7% | +68.3% | 5 of 16 |
| 6 monthly instalments | +8.7% | -8.3% | +68.7% | 7 of 16 |
Hypothetical equal-money entries on the signal day and every 21 trading days after, valued 12 months after the signal. Nifty price index, no costs or taxes. Not an Investock product or performance.
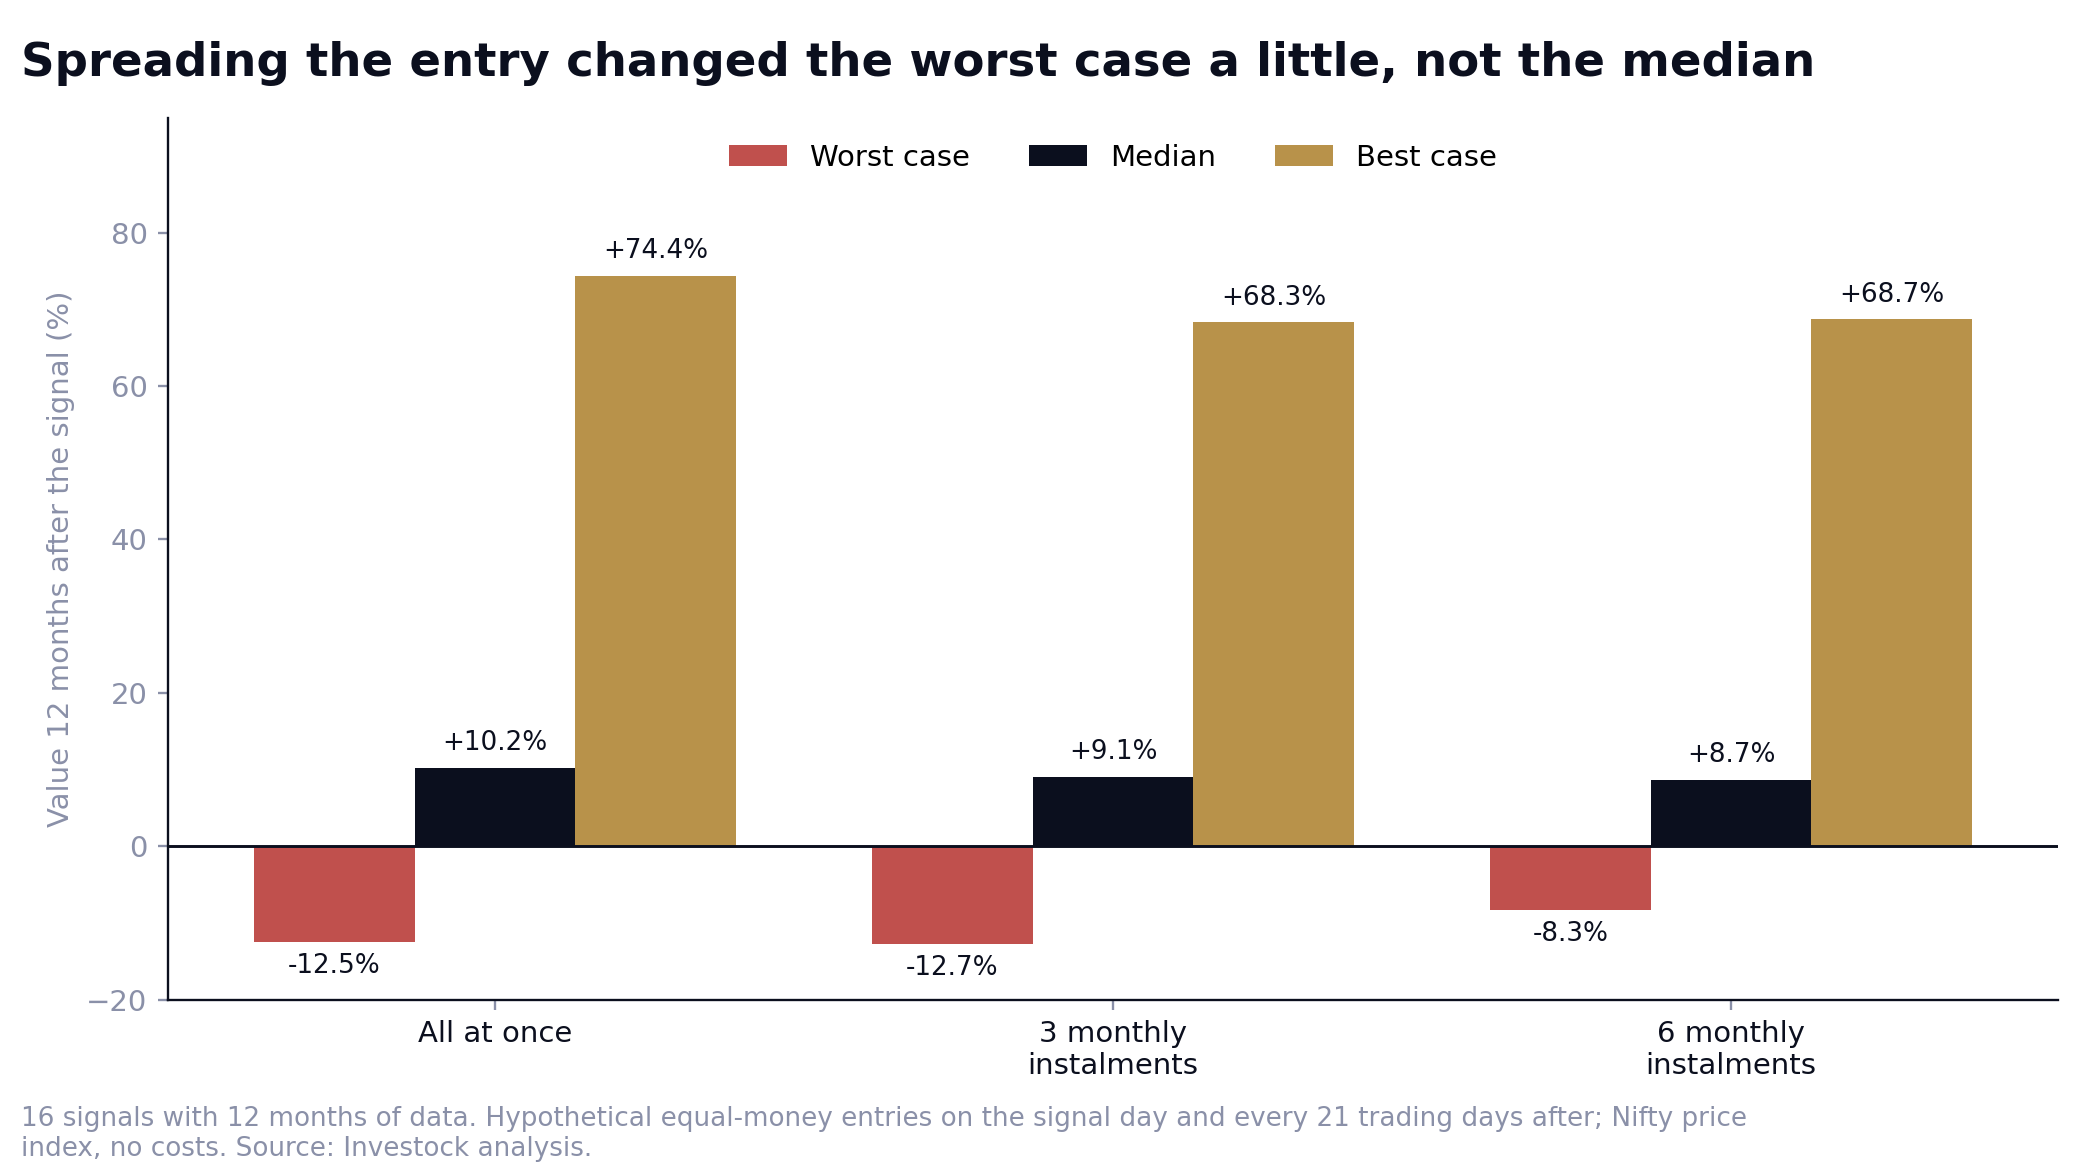
Staggering lost out when the market rebounded fast (2013, 2016, 2023) and helped when it kept falling (2008, 2011, 2015). Its main benefit in the data was not return. It was that a six-instalment plan never had to decide, in the middle of a scary week, whether to put everything in. If you plan instalments, write the schedule down first.
2. Size for the further fall, not the headline
In 7 of 17 cases the Nifty fell more than 10% further after the signal, and twice about 31%. A position or a total exposure that would force you to sell after a further 10% to 30% fall was too big before the fall started. Our post on position sizing shows the arithmetic: ten losses at 1% risk cost 9.6% of capital, while ten losses at 10% risk cost 65%.
3. Fix the rules before the news, not after
- Decide the maximum you are prepared to lose on any one idea, and the exit, before you enter.
- Do not borrow to 'win it back'. SEBI's FY26 study found 87.7% of individual F&O traders lost money.
- If you have a SIP, our 1 October post shows what pausing one cost in 2008 and 2020. Whether to continue depends on your goals and cash needs.
- Treat anyone who calls 'the bottom' with suspicion. The low arrived anywhere from 0 to 327 days after our signals.
A fear reading is a good reason to check your plan. The data does not make it a reason to trade.
How Investock thinks about a fear reading
We do not use a fear index to time anything, and nothing in this post is a forecast of the low. Our approach is process. In the Model Portfolio, positions are equal-weighted so no single stock dominates, new entries happen on one fixed day (Monday), and every position has a predefined exit rule. The portfolio is research only: we never handle your money. A rule-based exit cannot prevent a loss, especially if a stock gaps down, and a model portfolio can lose money. The point of a process is that it makes the decisions in advance, when you are calm, so that a reading of 11 is not the thing that decides.
What to watch next
| Date | Event | Why it matters |
|---|---|---|
| Tue 27 Oct | Nifty monthly expiry; more Q2 results this week (Upstox lists L&T, Maruti, HUL, Asian Paints, Coal India, Kotak Bank, Sun Pharma, among others) | Results season continues; company dates not confirmed by us |
| Wed 28 Oct | US Fed decision; Jio Platforms listing on NSE and BSE; India IIP data | US yields and the dollar drive foreign flows; listing absorbs attention and liquidity |
| Fridays | RBI forex reserves; weekly FPI and DII flow data | The cost of defending the rupee, and whether foreign selling is easing |
| Tue 3 Nov | US midterm elections | One research house argues India is exposed through yields, the Fed and the AI trade |
| About 12 Nov | India CPI for October (date inferred) | Whether inflation supports a further RBI move |
| 2 to 4 Dec | RBI policy meeting (single source) | Next rate decision |
| 7 Dec | SEBI changes expiry settlement for stock and index derivatives to the last 30-minute VWAP (circular of 15 Oct) | Affects derivatives traders |
Dates as reported; confirm before relying on them.
Commentators are also publishing levels. Upstox's analyst puts Nifty support at 22,372, then 22,217, with a risk of 22,000, and resistance at 22,800 to 22,840 and then 23,150. Paterson Capital gives support at 22,386 and resistance at 22,801. These are third-party technical views, not ours, and none of the commentary we found gave a view on how long the weakness will last.
Related reading
- Market down 8 weeks in a row: what history says and what you can do
- Crude at $110: what it means for India's economy, rupee and stocks
- Position sizing for small accounts: how much to put in one stock
- Why KOSPI crashed 7.6% and the Nikkei 4.8%: Asia's chip rout
Frequently asked questions
What is the fear and greed index?
A single 0 to 100 number that combines several market signals, such as price strength, breadth, volatility and demand for safer assets. Low readings mean fear and high readings mean greed. The chart behind this post puts India's reading at 11, with 'extreme fear' below about 25. Different publishers use different formulas, so readings are not comparable across indices. Tickertape's Market Mood Index, for example, was 23.9 on 12 October.
Is extreme fear a good time to buy?
The data does not say so. After 17 past signals in our gauge, the Nifty's median 12-month return was +10.2%, against +10.7% for any day since 2008. In 7 of 17 cases it fell more than 10% further first. We make no call on whether to buy.
How long will the market keep falling?
Nobody knows, and we found no published forecast of duration. History shows ranges. Earlier 10%-plus falls took a median 159 days from peak to low, with a range of 53 to 406 days. This one is 294 days old and 279 days to its low so far, longer than six of the nine earlier falls.
How much further can the Nifty fall?
After our 17 signals the median further fall was 8.6%, the range was 0% to 31%, and 7 cases fell more than 10% further. That describes the past and is not a forecast.
Why is the market falling when domestic investors are buying?
Foreign investors sold about ₹51,000 crore in October and domestic institutions bought about ₹59,000 crore. That has cushioned the Nifty but not stopped the fall, especially in mid-caps and small-caps. Crude near $116, US yields above 5%, an RBI rate hike and weaker guidance from a large IT company add to the pressure.
Does a high India VIX mean a bottom?
A very high VIX (above 30) marked the 2008 and 2009 signals, but the VIX has been about 17 in this fall, below its median of 21.6 on earlier signal days. A low VIX does not tell you the fall is over.
Should I stop my SIP?
That depends on your goals and cash needs, and this post cannot advise you personally. As history, pausing skips the instalments bought at the lowest prices; see our 1 October post. If you need the money soon, speak to a registered adviser.
Sources
- Index levels, drawdowns, signals, forward returns, staggered-entry test and all calculations: Investock analysis of daily closes for the Nifty 50 (from September 2007), Nifty 500, India VIX, USD/INR and Brent front-month futures (Yahoo Finance), to 23 October 2026. Price indices, excluding dividends.
- Fear and greed reading of 11, with lows of 7 (January 2025) and 13 (March 2026): a chart shared with us; publisher and method not identified. The chart's source line names NSE total-return indices and NSE bhavcopy breadth.
- Weekly moves, breadth, flows and levels: Upstox (25 October 2026), Paterson Capital (25 October), Kotak Neo (26 October), Angel One (13 October), Choice Wealth (18 October), HDFC Sky (12 October), Swarajya (18 October).
- Infosys Q2 FY27 results and guidance: Infosys Form 6-K (23 October 2026). Bank results: company results as reported on 17 October.
- RBI policy of 7 October 2026 and the Governor's statement: RBI and press reports. Fed and US yields: Upstox, Free Press Journal, Choice Wealth, Trading Economics.
- SEBI circular of 15 October 2026 on expiry settlement: Moneylife, Outlook Money and Outlook Business.
- Earlier Investock posts: 'Market Down 8 Weeks in a Row' (3 October), 'Position Sizing for Small Accounts' (9 October), 'Why KOSPI Crashed 7.6%' (15 October), 'Crude at $110' (21 October).